Standardisation, measurement and comparison of lateral size and thickness of few-layer graphene flakes
- Abstract number
- 200
- Presentation Form
- Poster
- Corresponding Email
- [email protected]
- Session
- Poster Session Two
- Authors
- Dr Kostas Despotelis (1), Dr Keith Paton (1), Dr Andrew Pollard (1), Dr Charles Clifford (1)
- Affiliations
-
1. National Physical Laboratory
- Keywords
AFM, SEM, graphene, 2D materials, intercomparision, standardisation,
- Abstract text
Graphene and other two-dimensional materials are finding applications in commercial products. There are over 100 commercial “graphene” producers. However issues remain. A crucial question that users must ask suppliers is “what is this material?”. Differences in structural and chemical properties between suppliers and batch to batch variations can be large. Standardisation and validated measurement methods to measure key characteristics are thus required.
The first version of ISO/TS 21356-1 ‘Structural characterization of graphene from powders and liquid dispersions [1,2] provides a flowchart of a multiple measurement technique approach to be able to characterize graphene related two-dimensional materials including lateral size, thickness and number of layers. This uses the combination of atomic force microscopy (AFM), scanning electron microscopy (SEM) and Raman spectroscopy. However there are no validated measurement methods in this first version of this international standard.
To address this, we have written a protocol [3] on the measurement of lateral size and thickness of few-layers graphene flakes using AFM and SEM. This has been tested via an international interlaboratory test, namely project 12 of VAMAS TWA 41 [4].
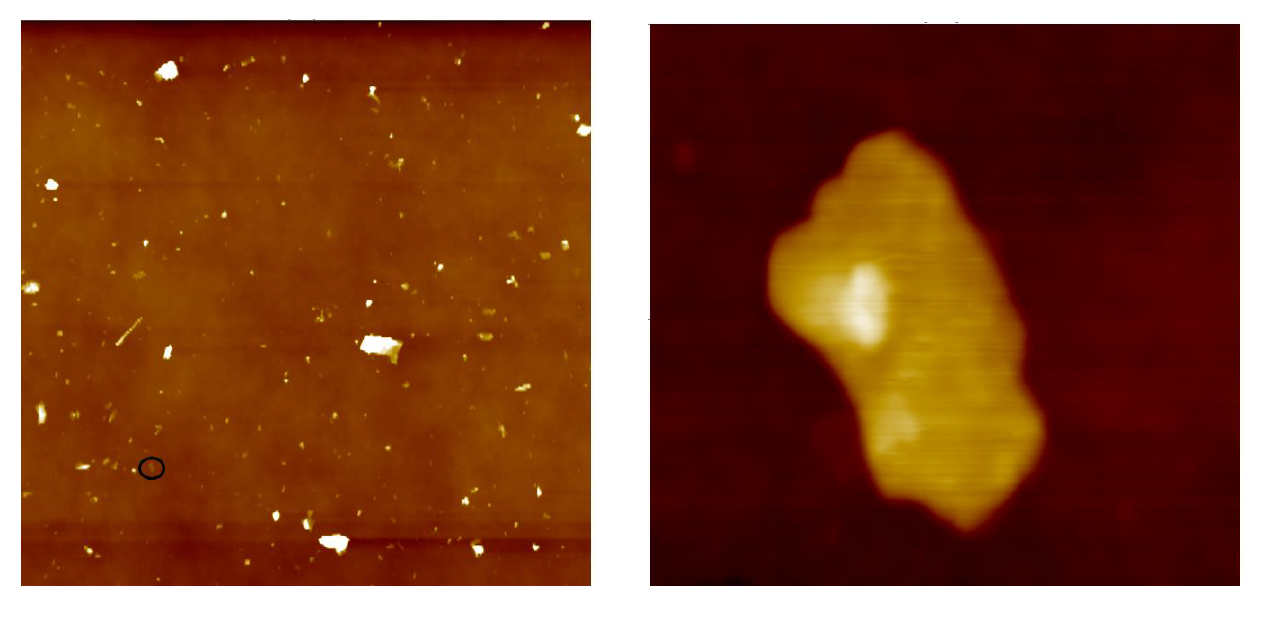
Figure 1. An example large scale (left, size 20 µm x 20 µm) and high-resolution (right) AFM topographic images of individual particle(s). No scale bars are included of the high-resolution image so as not to bias participants who have yet to report results.
Participants were asked to image and measure graphene nanoplatelets (GNPs) deposited onto two different Si/SiO2 substrates using SEM and AFM. Example AFM images are shown in Figure 1. Test samples to verify the calibration of instruments were also provided. Participants were asked to report the lateral flake size and thickness of the measured GNPs. The aim of the study is to understand the sources of uncertainty in these types of measurements, as well as within- and in-between laboratory measurement variability, for a group of laboratories spread across the globe. Here we summarize the results of the interlaboratory study, outline the issues found and highlight best practice.
- References
- ISO/TS 21356-1 Nanotechnologies — Structural characterization of graphene — Part 1: Graphene from powders and dispersions
- Clifford, C.A., Martins Ferreira, E.H., Fujimoto, T. et al. The importance of international standards for the graphene community. Nat Rev Phys 3, 233–235 (2021). https://doi.org/10.1038/s42254-021-00278-6
- Despotelis, K; Pollard, A; Clifford, C; Paton, K (2022) VAMAS TWA 41 - Graphene and related 2D materials project 12 - Distribution of lateral size and thickness of few-layer graphene flakes using SEM and AFM. SEM and AFM measurement protocol. NPL Report. AS 103 https://doi.org/10.47120/npl.AS103
- http://www.vamas.org/twa41/index.html