FISHtoFigure: A Single Molecule Fluorescent In Situ Hybridisation (SmFISH) Analysis Tool For The Analysis Of Transcriptional Activity In Tissues
- Abstract number
- 24
- Presentation Form
- Poster
- DOI
- 10.22443/rms.mmc2023.24
- Corresponding Email
- [email protected]
- Session
- Poster Session Two
- Authors
- Mr Calum Bentley-Abbot (2, 3), Ms Rhiannon Heslop (3), Dr Matthew Sinton (3), Ms Praveena Chandrasegaran (3), Dr Edward Hutchinson (2), Professor Gail McConnell (1), Dr Juan Quintana (3), Professor Annette MacLeod (3)
- Affiliations
-
1. Department of Physics, SUPA, University of Strathclyde
2. MRC-University of Glasgow Centre for Virus Research, School of Infection and Immunity, University of Glasgow
3. Wellcome Centre for Integrative Parasitology (WCIP), School of Biodiversity, One Health and Veterinary Medicine, University of Glasgow
- Keywords
smFISH, RNAScope, Spatial-omics, Transcriptomics, Data Processing, QuPath
- Abstract text
Introduction
Spatial transcriptomic tools, such as single molecule fluorescent in situ hybridisation (smFISH), provide a means to image transcriptional factors within tissues. However, resulting datasets are large and tools for quantifying mRNA transcript expression in these data are lacking, with those tools that do exist requiring significant bioinformatics experience to implement. The ability to accurately quantify mRNA signals and determine the mRNA expression profiles of cells is paramount to interpreting and capitalising on the plethora of information contained within smFISH datasets. Here, we present a tool for the automated detection and analysis of in situ hybridisation signals. Our tool allows users of all levels of bioinformatic experience to investigate smFISH data for specific cell types and quantify cell populations with specific transcriptional profiles based on hybridisation signals.
Methods
We developed a bioinformatic pipeline, using QuPath to quantify cells and RNA transcripts in smFISH data.1 We further developed a purpose-built, automated, Python-based analysis tool for conducting transcriptomic analysis on large quantified smFISH datasets, compatible with QuPath outputs. In order to expand the usability of this tool to those without a background in bioinformatics or data analysis, we developed a graphical user interface (GUI) for the tool such that analysis can be carried out without the need for bioinformatics experience.
Results and Discussion
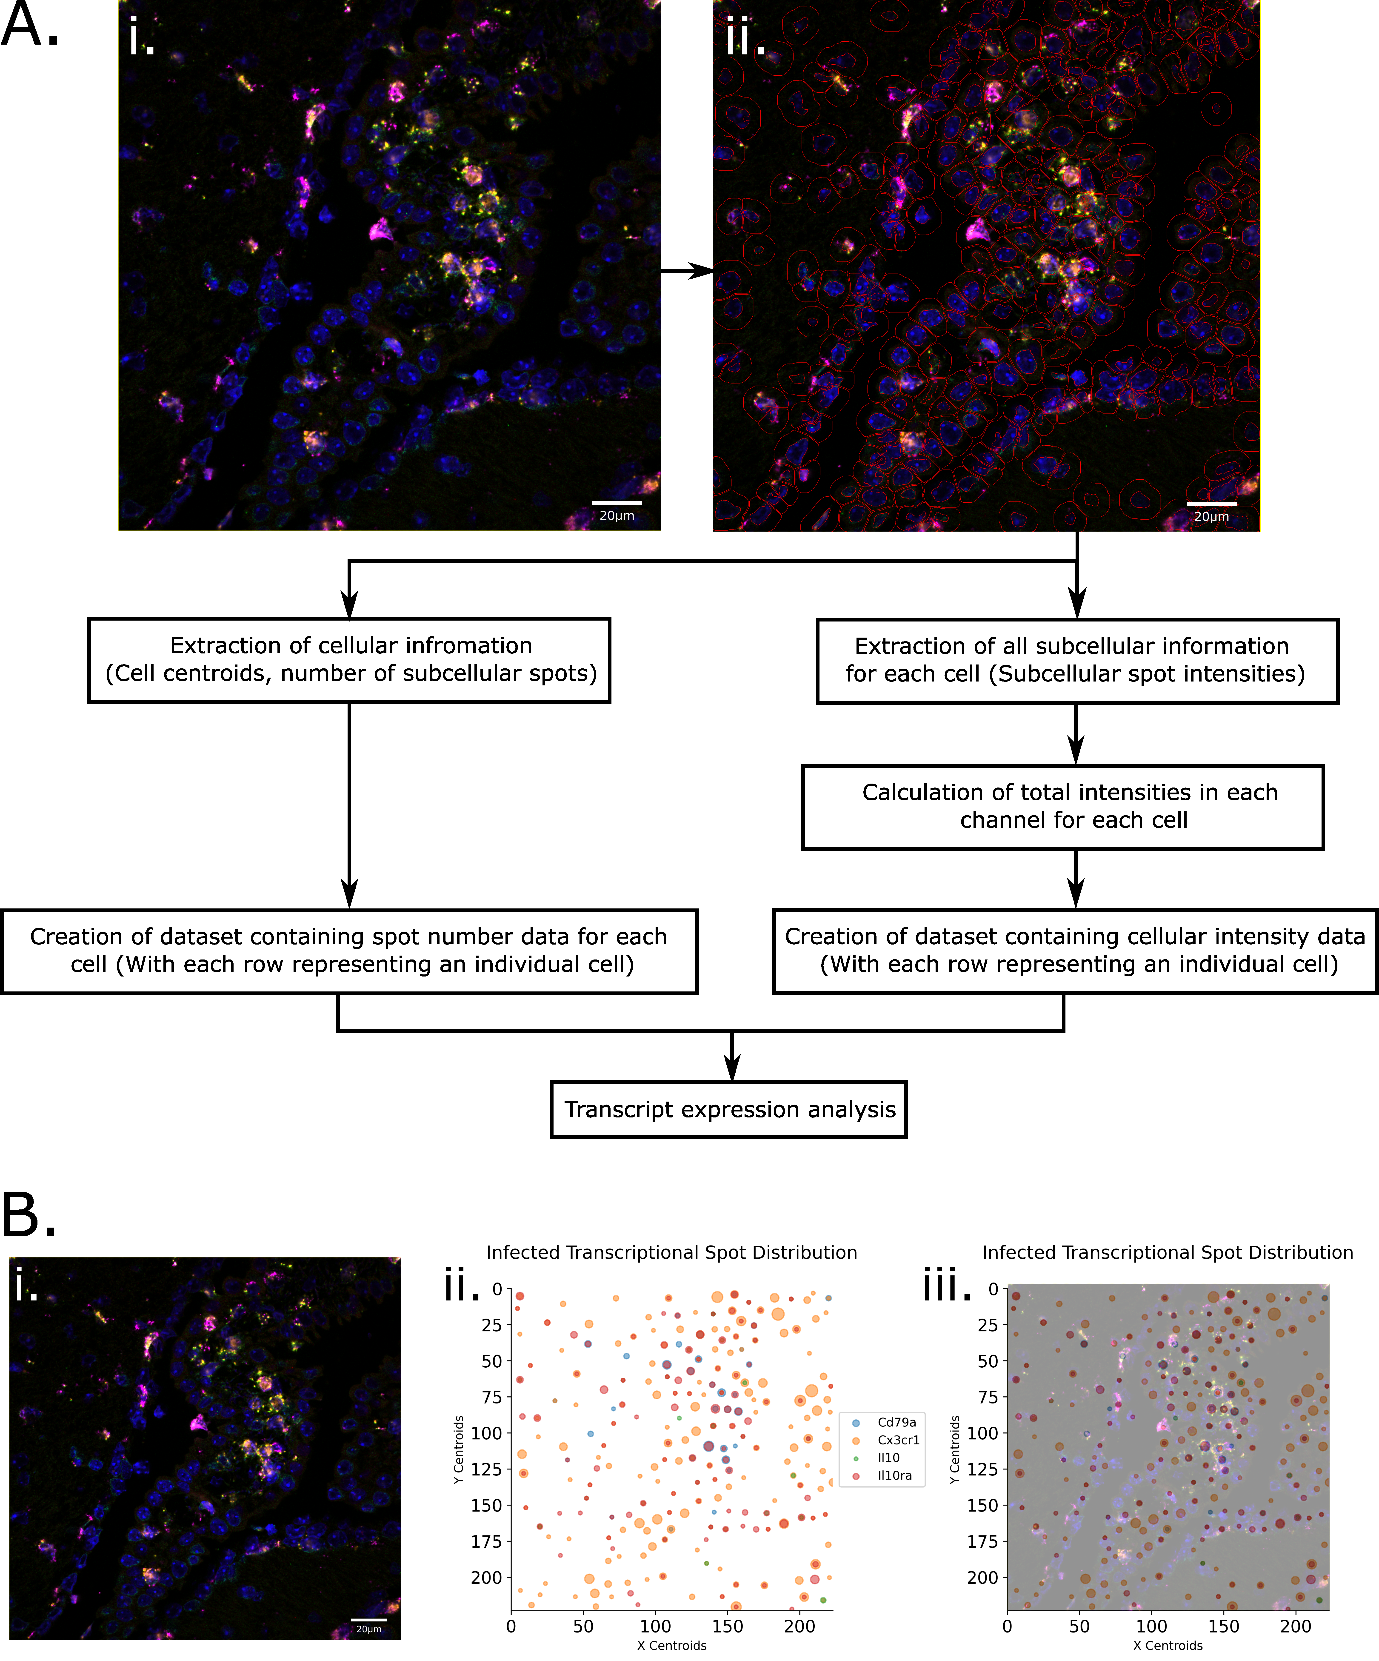
We have developed a robust analytical pipeline for transcriptional activity and cell type analysis in smFISH data, using QuPath to count cells positive for multiple targets with >75% accuracy, and our newly-developed, purpose-built tool to conduct downstream transcriptomic analysis, Figure 1A. Following QuPath quantification of single sub-cellular “transcriptional spots” (representing individual RNA transcripts) our tool, FISHtoFigure, enables the visualisation and analysis of transcript co-expression at the single cell level, Figure 1B. Our tool enables users to conduct differential analysis of the expression of RNA targets between QuPath-quantified smFISH datasets, enabling analysis of differential regulation of transcripts during biological processes such as infection, Figure 2A,B. Additionally, our tool enables the automatic partitioning of cells based on RNA co-expression and specific RNA targets, Figure 2C-E. This enables users to investigate the abundance of specific cell types - or cells with complex mRNA expression profiles exhibited during specific biological processes such as infection - without the need for a custom analysis pipeline. Co-expression analysis can be carried out for any combination of RNA transcripts and results are quantified and visualised as shown in Figure 1B.
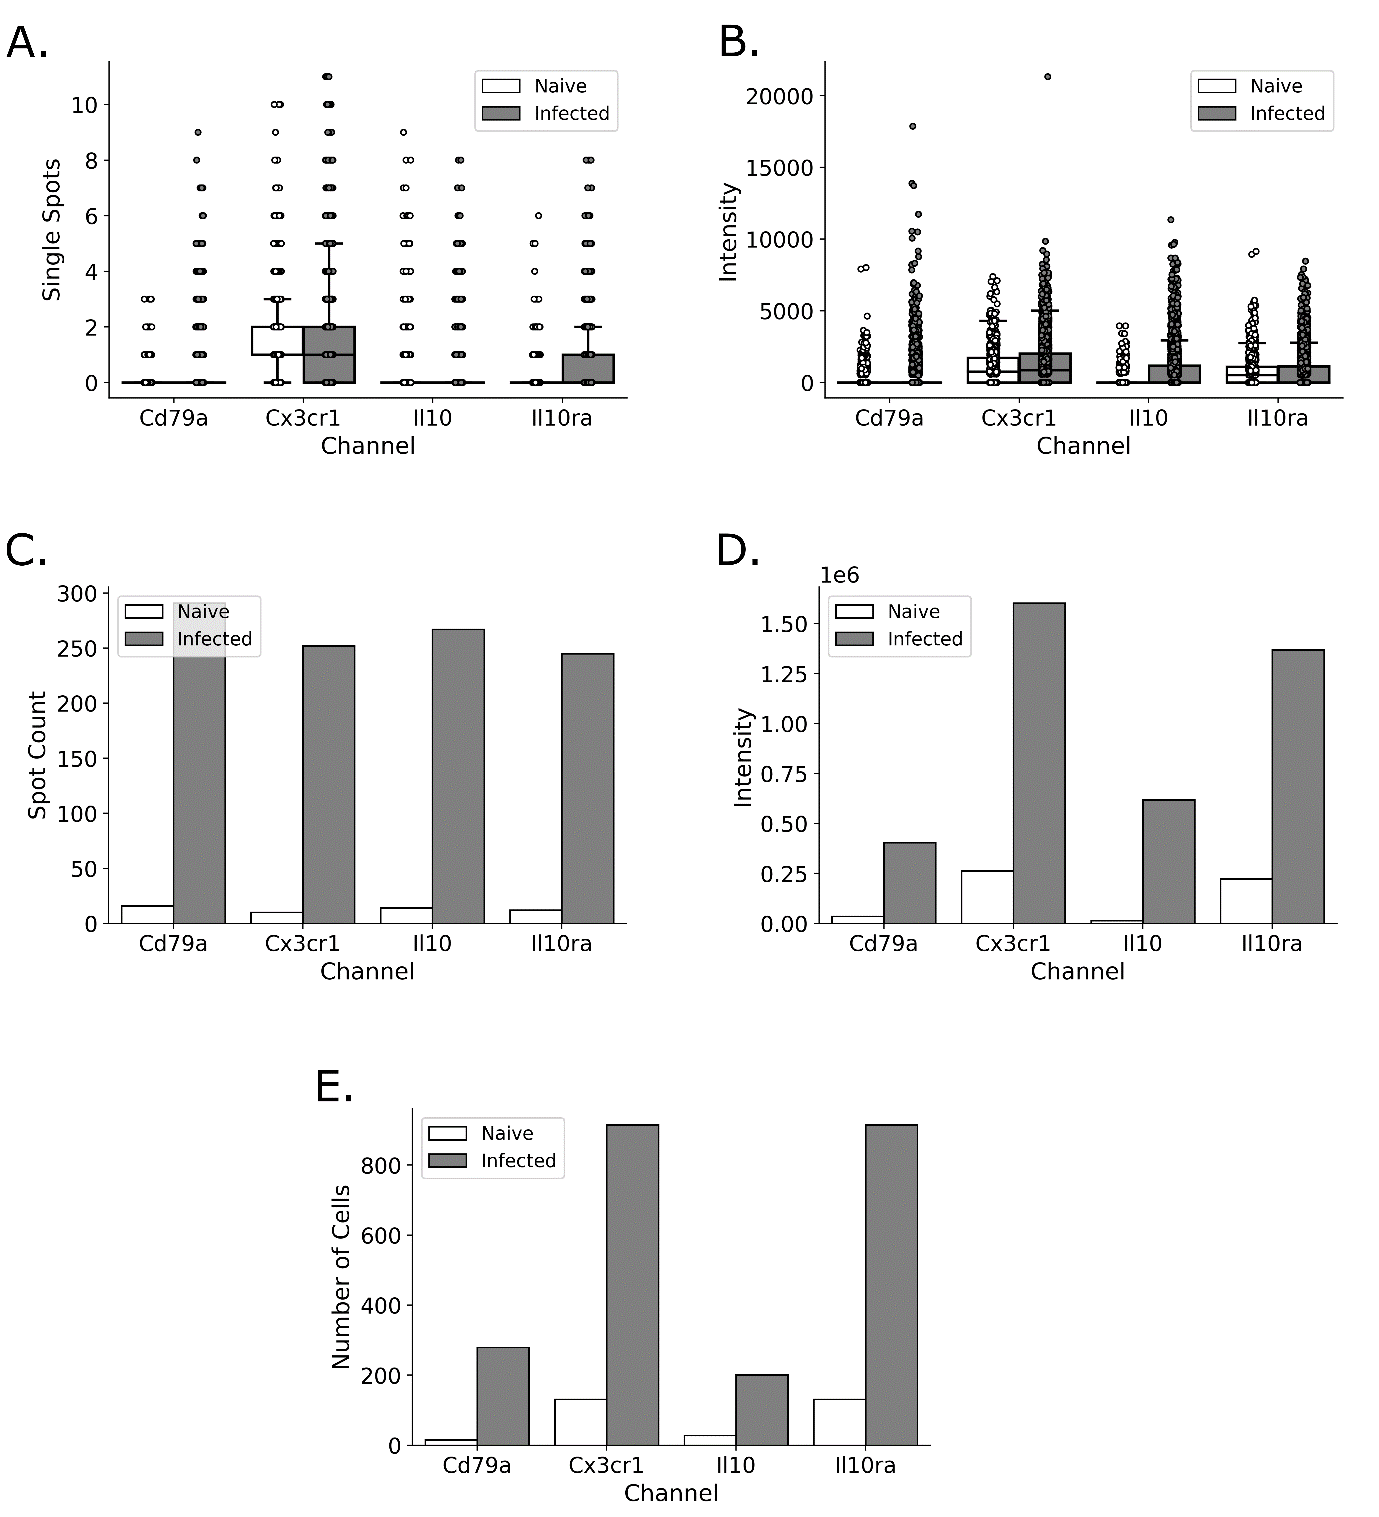
Using a previously obtained dataset of mice experimentally infected with trypanosomes, we demonstrate that our pipeline accurately and significantly detects an upregulation of the anti-inflammatory cytokine Il10 and its associated receptor Il10ra, Figure 2A,B.2 Additionally, our pipeline reveals and quantifies spatially-resolved co-expression of Il10 and Cd79a B cells, and Il10ra and Cx3cr1 in microglia, in the brains of infected mice compared to naïve controls, Figure 2C-E. These findings validated a crosstalk between B cells and microglia suggested by spatial and single cell transcriptomics in the T. b. brucei infected brain. We are now using these tools to investigate reassortment between viral strains in Influenza A virus co-infections. These findings will offer insights into events underpinning novel viral strain evolution and pandemic strain emergence.
Conclusion
Our pipeline offers semi-automated data processing for multi-dimensional, multi-target smFISH datasets and can be applied to a variety of biological questions. By generating a stand-alone, GUI-driven tool for the analysis of smFISH data, we offer a means to conduct in-depth analysis of mRNA expression and cell type abundance without extensive bioinformatics skills or experience. Integration of smFISH with this pipeline facilitates the investigation of molecular interactions between cell populations in tissues during health and disease.
Figure 1
Figure 1: Using FISHtoFigure, QuPath-quantified smFISH data can be handled in an automated fashion without any interaction with raw quantified image data. A: Flow chart showing the whole FISHtoFigure pipeline. Cellular boundaries and subcellular fluorescent spots in RNAScope images captured via confocal microscopy (Zeiss LSM 880) [i] were quantified using QuPath [ii]; quantified cell boundaries are shown in red. Due to the variability of the nuclear staining, some regions quantified as cells appear empty upon inspection by eye. Nuclear staining in these regions becomes visible when altering contrast and saturation. Here, contrast was chosen as a compromise between nuclei visibility and saturation of highly stained regions. B: An RNAScope image, captured by confocal microscopy (Zeiss LSM 880) [i], is validated using FISHtoFigure [ii]. Directly overlaying the captured smFISH image with the plot produced by FISHtoFigure demonstrates a high fidelity in this validation method [iii].
Figure 2
Figure 2: FISHtoFigure provides the means to conduct transcript abundance analysis for individual targets or for complex, multi-target cell expression profiles in both a cell-wise (A,B), or a tissue-wide manner (C-E). Here, differential target abundance analysis conducted as part of the experiments on the T. brucei infected mouse brain data are shown as examples of FISHtoFigure outputs. A: Number of RNA transcripts expressed for each RNA target, plotted in a cell-wise fashion, with each data point representing a cell. Box limits are defined by the interquartile range (IQR) with whiskers extending to the lowest/highest data point still within 1.5 IQR of the lower/upper quartile. B: The fluorescent intensity for each RNA target plotted in a cell-wise manner as for Figure 2A. Each spot represents a cell. C-E: Examples of the use of FISHtoFigure to partition datasets to analyse only cells positive for multiple targets. Here, the dataset was partitioned such that only cells co-expressing Il10 and Cd79a (C) or Il10ra and Cx3Cr1 (D,E) were analysed. C: Total spot count across all cells for each RNA target for the partition of cells double positive for Il10 and Cd79a. D: Total intensity across all cells for each RNA target for the partition of cells double positive for Il10ra and Cx3cr1. E: Total number of cells expressing at least one copy of each transcript channel for the partition of cells double positive for Il10ra and Cx3cr1.
- References
1: Bankhead, P. et al. QuPath: Open source software for digital pathology image analysis. Sci. Rep. 7, 16878 (2017).
2: Quintana, J. F. et al. Single cell and spatial transcriptomic analyses reveal microglia-plasma cell crosstalk in the brain during Trypanosoma brucei infection. Nat Comms. 13, 5752 (2022)