Revealing the 2D distribution of lithium in cathode materials using the composition-by-difference method
- Abstract number
- 265
- Presentation Form
- Poster
- DOI
- 10.22443/rms.mmc2023.265
- Corresponding Email
- [email protected]
- Session
- Poster Session Three
- Authors
- Dr. Jonathan Lee (2), Dr. David Stowe (2), Dr. Shangshang Mu (1)
- Affiliations
-
1. EDAX LLC
2. Gatan, Inc.
- Keywords
Lithium, battery, cathode, composition-by-difference, Cipher, EDS, Energy Dispersive X-ray Spectroscopy, BSE, qBSE, NMC
- Abstract text
Summary
Cipher’s composition-by-difference is used to map the lithium distribution in the scanning electron microscope (SEM). Through combination of energy dispersive X-ray spectroscopy (EDS) and quantified backscatter electron (qBSE) imaging, the Li content in a metal-oxide cathode material is estimated. The mean lithium content was found to be approximately 23.8 at.%.
Introduction
Lithium- (Li-) based products have gained significant market acceptance in a diverse range of energy storage applications due to their superior capacity and lighter mass. To understand and optimize properties of cathodes used in battery applications, it is desirable to correlate and control the structural properties and elemental composition of these materials and study their evolution over a battery’s lifetime.
Commonly used elemental analysis techniques, like EDS, are unsuitable for Li detection in battery materials; many researchers have noted that although specialized EDS detectors can be used to detect X-rays from metallic lithium, no Li X-rays are generated when the lithium is bonded to oxygen—a considerable barrier when considering typical cathode materials. However, recently, a quantitative estimation of the Li content in a LiAlMg alloy [1] was performed successfully using a composition-by-difference (CDM) method based on elemental quantification by EDS and quantitative backscattered electron (qBSE) microscopy and subsequently extended to oxides [2].
NMC materials used in the construction of battery cathodes are agglomerate oxide particles which, in the uncharged cell state, contain ~ 25 at. % Li. NMCs have a chemical formula Li(NixMnyCoz)O2 and are commonly described by the ratio of nickel to manganese to cobalt e.g., NMC xyz.
In this study, we show how Cipher can be used to accurately map elemental composition—including lithium—of NMC 811 particles with sub-micron spatial resolution.
Methodology
A commercially available NMC 811 powder with nominal lithium composition 7.3 ± 0.3 wt. % was analyzed using a Cipher system (Gatan Inc.) attached to an FE-SEM. The sample was prepared for analysis by embedding in epoxy and cross-sectioned by broad beam argon milling.
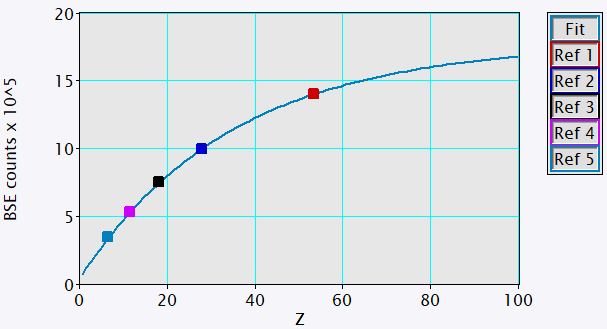
BSE and EDS analyses were performed using the OnPoint (BSE) detector and Octane Elite Super EDS detector of the Cipher system respectively. The intensity scale of BSE images was calibrated for mean atomic numbers 6 – 53 using 5 high-purity standards according to the modified electron approach [3], Figure 1.
Figure 1. Plot of measured BSE intensity versus mean atomic number for 5 high-purity samples used as calibration standards (squares). Modified electron model used for converting BSE intensity to mean atomic number (line).
Results and discussion
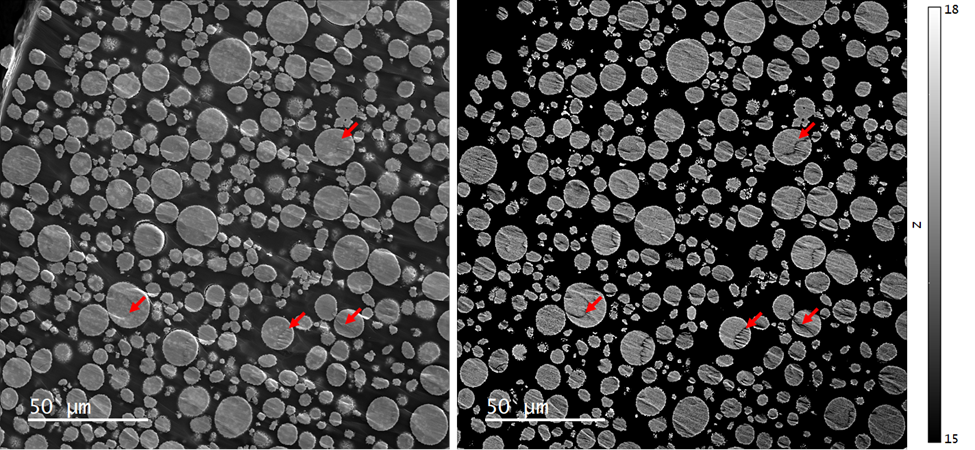
Secondary electron (SE) and BSE images revealed NMC particles, ranging from approximately 5 to 20 µm in diameter and that these secondary particles consisted of several hundred smaller primary particles, typically 50 - < 1,000 nm in size, Figure 2. Comparison of the SE and BSE images revealed that some topographic features associated with artefacts in sample preparation contributed to the BSE signal.
Figure 2. (Left) Secondary electron and (right) quantitative backscattered electron (qBSE) images of an NMC 811 powder embedded in epoxy and cross-sectioned by broad beam argon milling. The intensity scale of the qBSE image has been set to display effective atomic number 15 – 18. (Red arrows) Significant topographical influence.
For quantitative analysis of the BSE signal, an accelerating voltage of 10 kV was selected. At this condition, the effect of channeling contrast—which was significant at lower accelerating voltages—was effectively mitigated, whilst a spatial resolution suitable for analysis of smaller NMC secondary particles was retained.
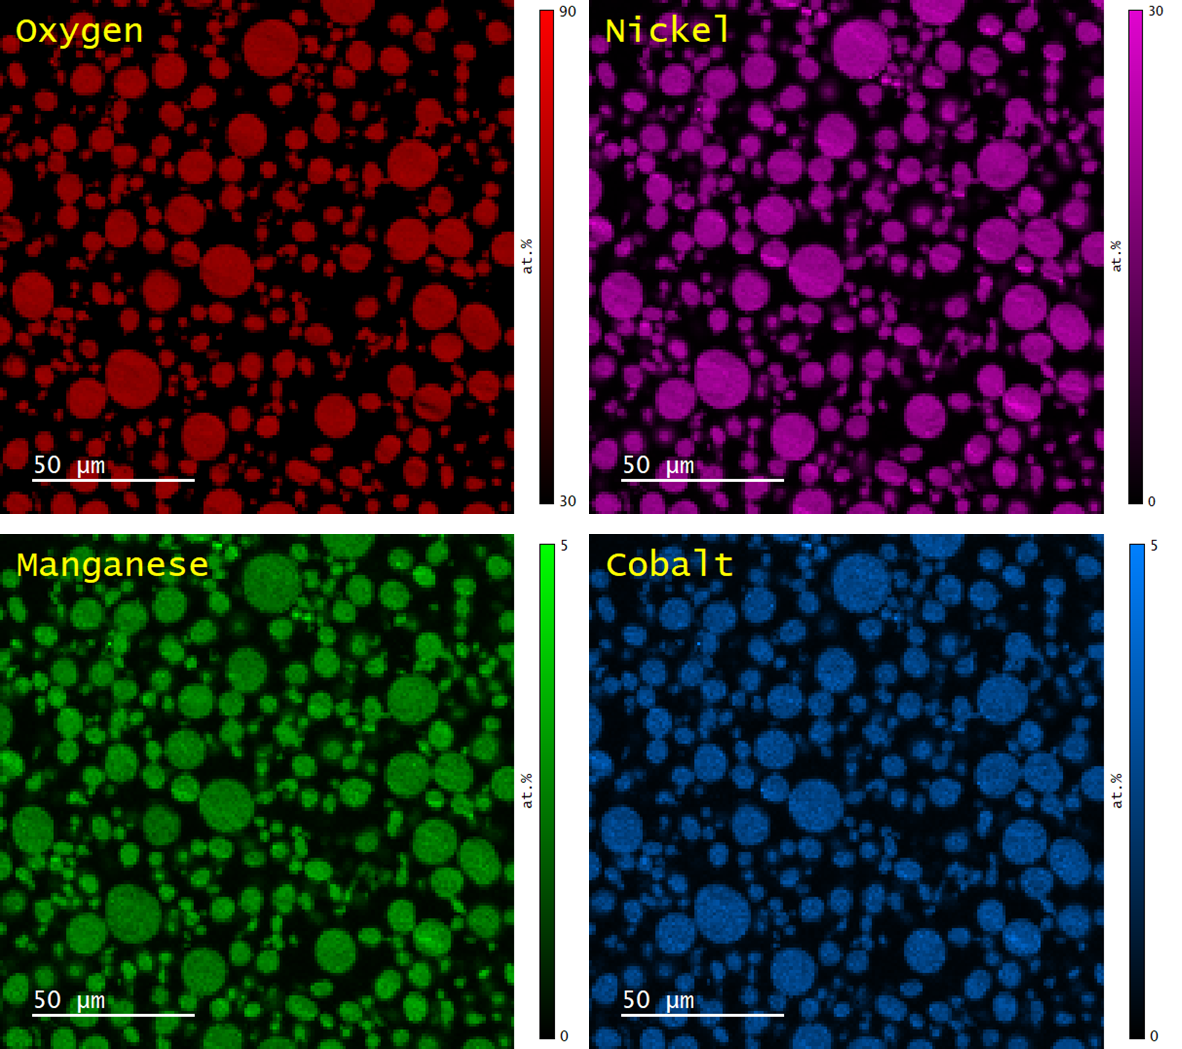
The distributions of Ni, Mn, and Co in ~300 particles were found by EDS mapping, Figure 3. Quantitative evaluation of the Ni, Mn and Co content was determined using the standardless eZAF correction method. The mean Ni:Mn:Co ratio was determined to be 8.07:1.0:1.01, consistent with the nominal composition of the NMC 811 powder however, ~5 % of particles were found to have a Mn content ~50% lower than the mean.
Figure 3. Elemental maps of O (red), Ni (magenta), Mn (green) and Co (blue) as determined by quantitative analysis of EDS.
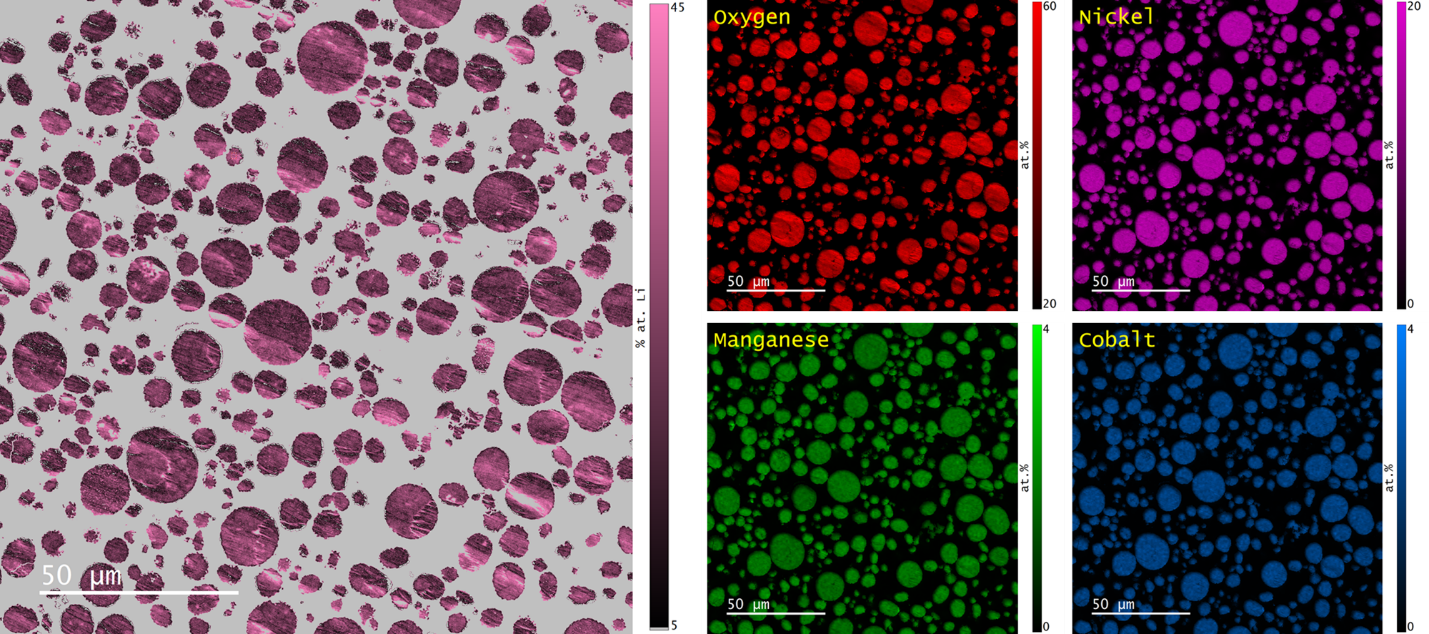
Registration of the two data types was performed based on cross correlation of the SE images that were captured synchronously with each signal. Adjustments for image rotation, magnification, and sampling were applied. The co-aligned elemental maps and qBSE data were then used to calculate the Li content using Cipher’s composition-by-difference method, Figure 4.
Figure 4. (left) Map of the Li content in NMC 811 particles and (right) re-scaled O, Ni, Mn, and Co elemental maps after accounting for the Li content. Note that the grey color in the lithium map corresponds to regions of the sample that were not targeted for this analysis.
The mean lithium content of an NMC particle was determined to be 23.8 ± 3.9 at. %. As expected, some regions of the specimen with strong topography produced anomalously high lithium values (indicated by arrows in Figure 5) however, the intraparticle variation was low and no significant difference in lithium content was observed between particles.
This result paves the way towards being able to study lithium migration at the microscale during the charge-discharge cycle in battery cells promising to deliver new insights into structural and compositional evolution over a cell’s lifetime.
Summary and conclusions
Cipher has been used to estimate the Li content in ~100 NMC 811 particles, determining a mean lithium content of approximately 23.8 ± 3.9 (nominally 25) at. %. This result demonstrates quantifiable microscale resolution Li detection in this prospective cathode material, generalizable to other materials containing light elements, using Cipher analysis.
- References
[1] J.A. Österreicher et al., Scripta Materialia 194 (2021), 113664
[2] J. Lee et al., Microsc. Microanal. 28 (2022), p548-550
[3] J. Donovan et al., Microsc. Microanal. 9 (2003), p. 202