Probing redox in Li-ion battery cathode materials using electron imaging and spectroscopy
- Abstract number
- 556
- Presentation Form
- Poster
- DOI
- 10.22443/rms.mmc2023.556
- Corresponding Email
- [email protected]
- Session
- Poster Session Three
- Authors
- Viktor Ellingsson (1), Peter Nellist (1), Rebecca Nicholls (1), Liquan Pi (1)
- Affiliations
-
1. University of Oxford
- Keywords
- Energy materials (storage, generation, efficiency, etc)
- High-resolution EM, HAADF, and EELS
- Abstract text
Li-ion cathode materials in the disordered rocksalt (DRS) phase are a promising avenue for high-stability and high-capacity batteries. These DRS materials can be made with earth-abundant elements that suffer from phase transitions in the more common layered configurations. They have been shown to be able to possess high capacities and superior cycling stability, for certain stoichiometries, as compared to layered materials [1]. Currently, the activity and material properties of these DRS cathodes are not well understood which limits the rational design of next-generation cathodes.
So far, the characterization of these DRS cathodes has shown that despite the cation disorder, these materials possess SRO, which determines the Li-ion percolation [2]. The measure of available lithium in the cathode material is one of the main factors that control the electrochemical activity of these materials, so quantifying the SRO is essential. In addition, the bonding and chemical environment of the redox-active atoms is often quantified via EELS white-line ratio, which can give information about the oxidation state [3].
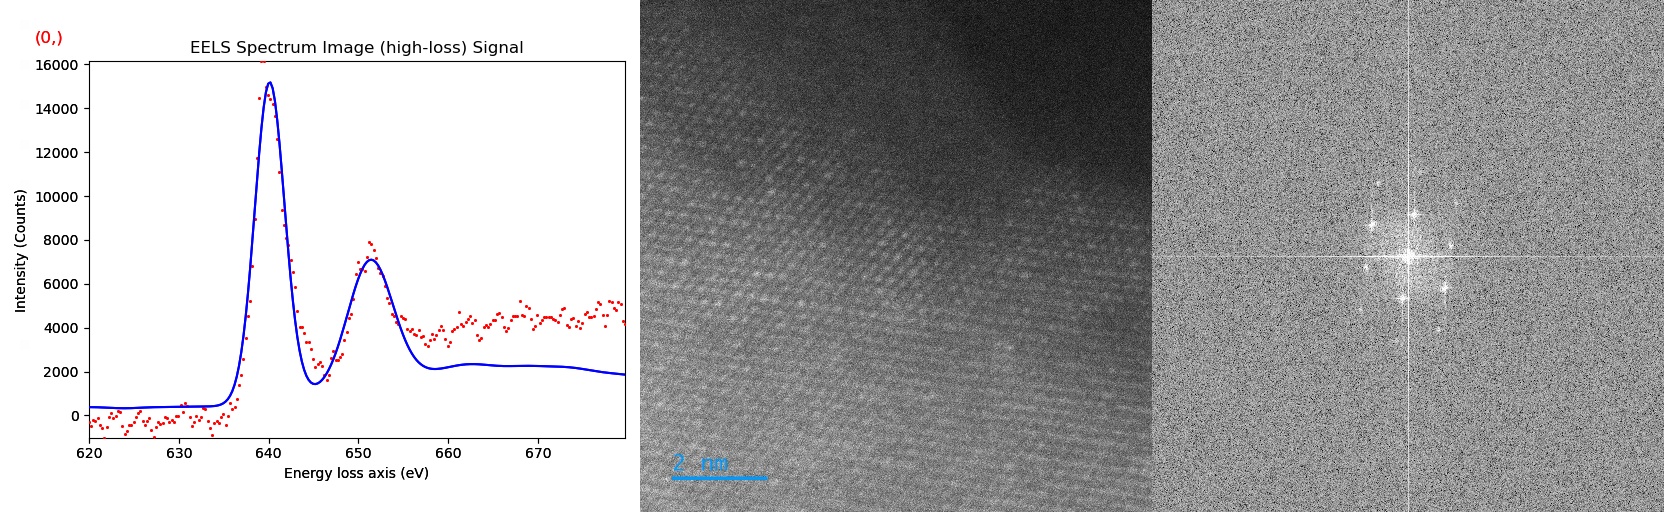
Utilizing simultaneous HAADF and EELS acquisition both the SRO and the chemical environment of the cathode material are determined. Using Python software packages such as HyperSpy this data is analyzed to yield the white line ratio and chemical composition which is then correlated to the available lithium content, see fig 1. The SRO is obtained by the Fourier transform of the acquired HAADF image, see fig 1.
Fig 1: a) EELS data collected from an LTMO sample, red dots, with the Mn L3 and L2 edges marked and the model fitting displayed, solid blue line. b) HAADF image of the LTMO sample. c) The binned FFT of the HAADF image
- References
References
[1] T. Sato, K. Sato, W. Zhao, Y. Kajiya, and N. Yabuuchi, ‘Metastable and nanosize cation-disordered rocksalt-type oxides: revisit of stoichiometric LiMnO 2 and NaMnO 2’, J. Mater. Chem. A, vol. 6, no. 28, pp. 13943–13951, 2018, doi: 10.1039/C8TA03667E.
[2] H. Ji et al., ‘Hidden structural and chemical order controls lithium transport in cation-disordered oxides for rechargeable batteries’, Nat Commun, vol. 10, no. 1, p. 592, Dec. 2019, doi: 10.1038/s41467-019-08490-w.
[3] T. G. Sparrow, B. G. Williams, C. N. R. Rao, and J.-M. Thomas, ‘Lx/L, WHITE-LINE INTENSITY RATIOS IN THE ELECTRON ENERGY-LOSS SPECTRA OF 3d TRANSITION-METAL OXIDES’, CHEMICAL PHYSICS LETTERS, vol. 108, no. 6, p. 4, 1984.