Electron Compton spectroscopy free from dynamical scattering artefacts
- Abstract number
- 188
- Presentation Form
- Contributed Talk
- DOI
- 10.22443/rms.mmc2023.188
- Corresponding Email
- [email protected]
- Session
- EMAG - EM Spectroscopy
- Authors
- Dr Budhika Mendis (1), Dr Alina Talmantaite (1)
- Affiliations
-
1. Durham University
- Keywords
- Abstract text
At large scattering angles the electron energy loss spectrum (EELS) contains a broad peak due to Compton inelastic scattering of the incident electron with an electron in the solid. The Compton peak contains information on the electronic structure of the solid, specifically J(pz), which is the density of solid-state electrons with momentum component pz along the scattering vector direction. The application of electron Compton spectroscopy to crystalline solids has historically been limited due to artefacts caused by dynamical scattering. In particular, Bragg beams can act as secondary sources for Compton scattering, which distort the overall shape of the measured Compton profile, thereby giving unreliable values for J(pz).
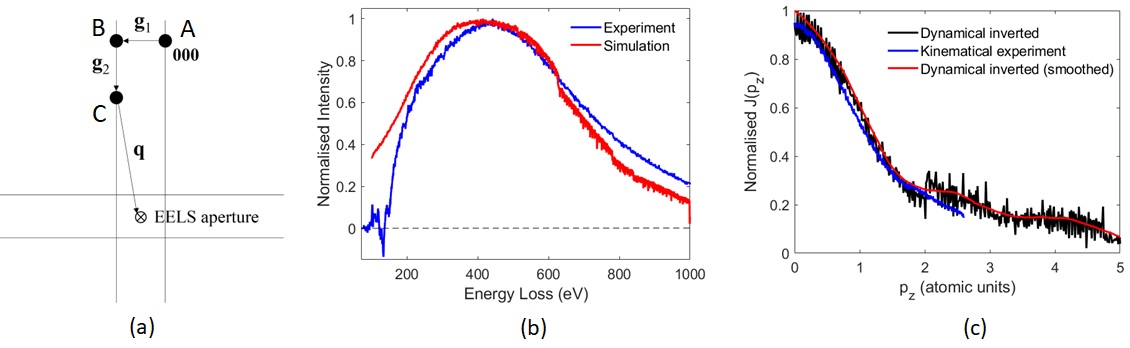
We have developed a simulation-based method for removing dynamical scattering artefacts in Compton profiles post EELS acquisition. The principle is illustrated in Figure 1a. Prior to Compton scattering the incident beam can undergo Bragg diffraction along the reciprocal vector g1 (point ‘A’ to point ‘B’). Following the Compton inelastic event the high energy electron can undergo further Bragg scattering along g2 (point ‘B’ to point ‘C’) as it exits the crystal. Therefore, the Compton scattering vector detected by the EELS spectrometer is given by q. The pre-Compton Bragg beam intensities (e.g. point ‘B’) are calculated using a standard ‘forward’ multislice simulation, i.e. the electron beam is incident at the specimen entrance surface. For post-Compton Bragg scattering (e.g. point ‘C’) a ‘reverse’ multislice simulation based on principle of reciprocity is used, i.e. the direction of the electron beam is reversed, so that it propagates from the EELS spectrometer into the sample.
Using the above procedure it is possible to perform two types of calculations. Firstly, starting from a known J(pz) the overall Compton profile shape can be determined. This is illustrated in Figure 1b. The experimental Compton profile was measured from a 70 nm thick, Si sample in the [110]-orientation. Strong diffraction along the zone-axis causes the Compton profile shape to be highly asymmetric. Using J(pz) data measured from the same sample under kinematical diffraction conditions the Compton profile was calculated via the forward and reverse multislice method. The simulated Compton profile shows good agreement with experiment, thus validating our method. Secondly, the data can also be inverted to extract J(pz) from a measured Compton profile. This was applied to the experimental Compton profile in Figure 1b. The inverted J(pz) is shown in Figure 1c, superimposed with the kinematically measured J(pz).The good agreement between the two curves indicate that dynamical scattering artefacts have been successfully removed.
In summary, we have developed a multislice-based simulation procedure for removing dynamical scattering artefacts from electron Compton spectra. This allows reliable electronic structure data to be measured from crystalline materials for the first time.
Figure 1: (a) schematic illustration of the multislice algorithm used for modelling dynamical scattering in electron Compton spectra. (b) the experimentally measured, and simulated, Compton profiles for a 70 nm thick, [110]-Si specimen. (c) the J(pz) curve obtained by inverting the experimental Compton profile in (b); the black and red curves are the raw and smoothed data respectively. J(pz) measured under kinematical diffraction conditions (blue curve) is also superimposed.