Evaluation of the impact of applying growth interruption stages in the growth of ultrathin GaAsSb layers.
- Abstract number
- 154
- Presentation Form
- Contributed Talk
- DOI
- 10.22443/rms.mmc2023.154
- Corresponding Email
- [email protected]
- Session
- EMAG - Microscopy of Semiconductors
- Authors
- Sara Flores (1), Daniel Fernández de los Reyes (1), Verónica Braza (1), Teresa Ben (1), Alejandro Gallego (3), Lazar Stanojević (2), Malte Schwarz (3), Jose Maria Ulloa (3), David Gonzalez (1)
- Affiliations
-
1. Universidad de Cádiz
2. Universidad politécnic de Madrid
3. Universidad politécnica de Madrid
- Keywords
- Segregation
- III-Sb alloys
- STEM analyses
- Abstract text
SUMMARY
The strong surface segregation tendency of Sb in III-V semiconductor alloys poses a real problem for epitaxial growth of ultrathin nanostructures like quantum wells or superlattices. In this work, the effect of the application of different growth interruption (GI) strategies on the compositional profiles of ultrathin GaAsSb films is studied using advanced STEM techniques. In particular, the segregation phenomenon with the use of soaking/desorption steps before and after the growth of GaAsSb layers is monitored by inserting AlAs markers into the structure. These strategies affect not only the shape of the Sb content profiles, but also the position of the onset of Sb incorporation.
INTRODUCTION
III-V-Sb systems are of interest because of their wide bandgap range (0.17-1.8 eV) and the ability to tune from type I to type II band alignment, allowing the design of devices operating from near to the far infrared. However, the presence of two group-V elements makes the growth of these compounds challenging due to anion exchange reactions. Thus, surface segregation phenomena driven by growth kinetics or thermodynamics often hinder the formation of sharp interfaces. In the case of GaAsSb layers, different growth approaches have been proposed in the literature, such as exposing the surface to Sb and/or As fluxes before (soaking) or after (desorption) the deposition of the GaAsSb layer. Our analysis allows us to evaluate the morphological evolution of the profiles as a function of deposition time by using ultrathin AlAs layers as markers to define the exact position where the Sb incorporation starts.
METHOD AND MATERIALS
Four samples with the same structure of 8 different periods were grown by Molecular Beam Epitaxy (MBE) on GaAs substrates. In each of these periods, a GaAsSb layer with increasing thickness of 1, 2, 3, 5, 7, 10, 15 and 20 MLs is embedded in GaAs (10 + 25 ML) with a 1 ML layer of AlAs used as a marker. Two different GI strategies were evaluated during growth. For Sb soak, the Sb and As shutters are opened for 30 seconds prior to the growth of each GaAsSb layer. For Sb desorption, only the As shutter is opened for 90 seconds during a short anneal process after deposition of the GaAsSb layer. Four samples, designated R, S, D and SD, were grown with no GI, with soaking only, with desorption only and with both, respectively. Compositional studies using Energy Dispersive X-ray (EDX) techniques were carried out in a Talos F200X and a double aberration corrected FEI Titan Cubed Themis TEM.
RESULTS AND DISCUSSION
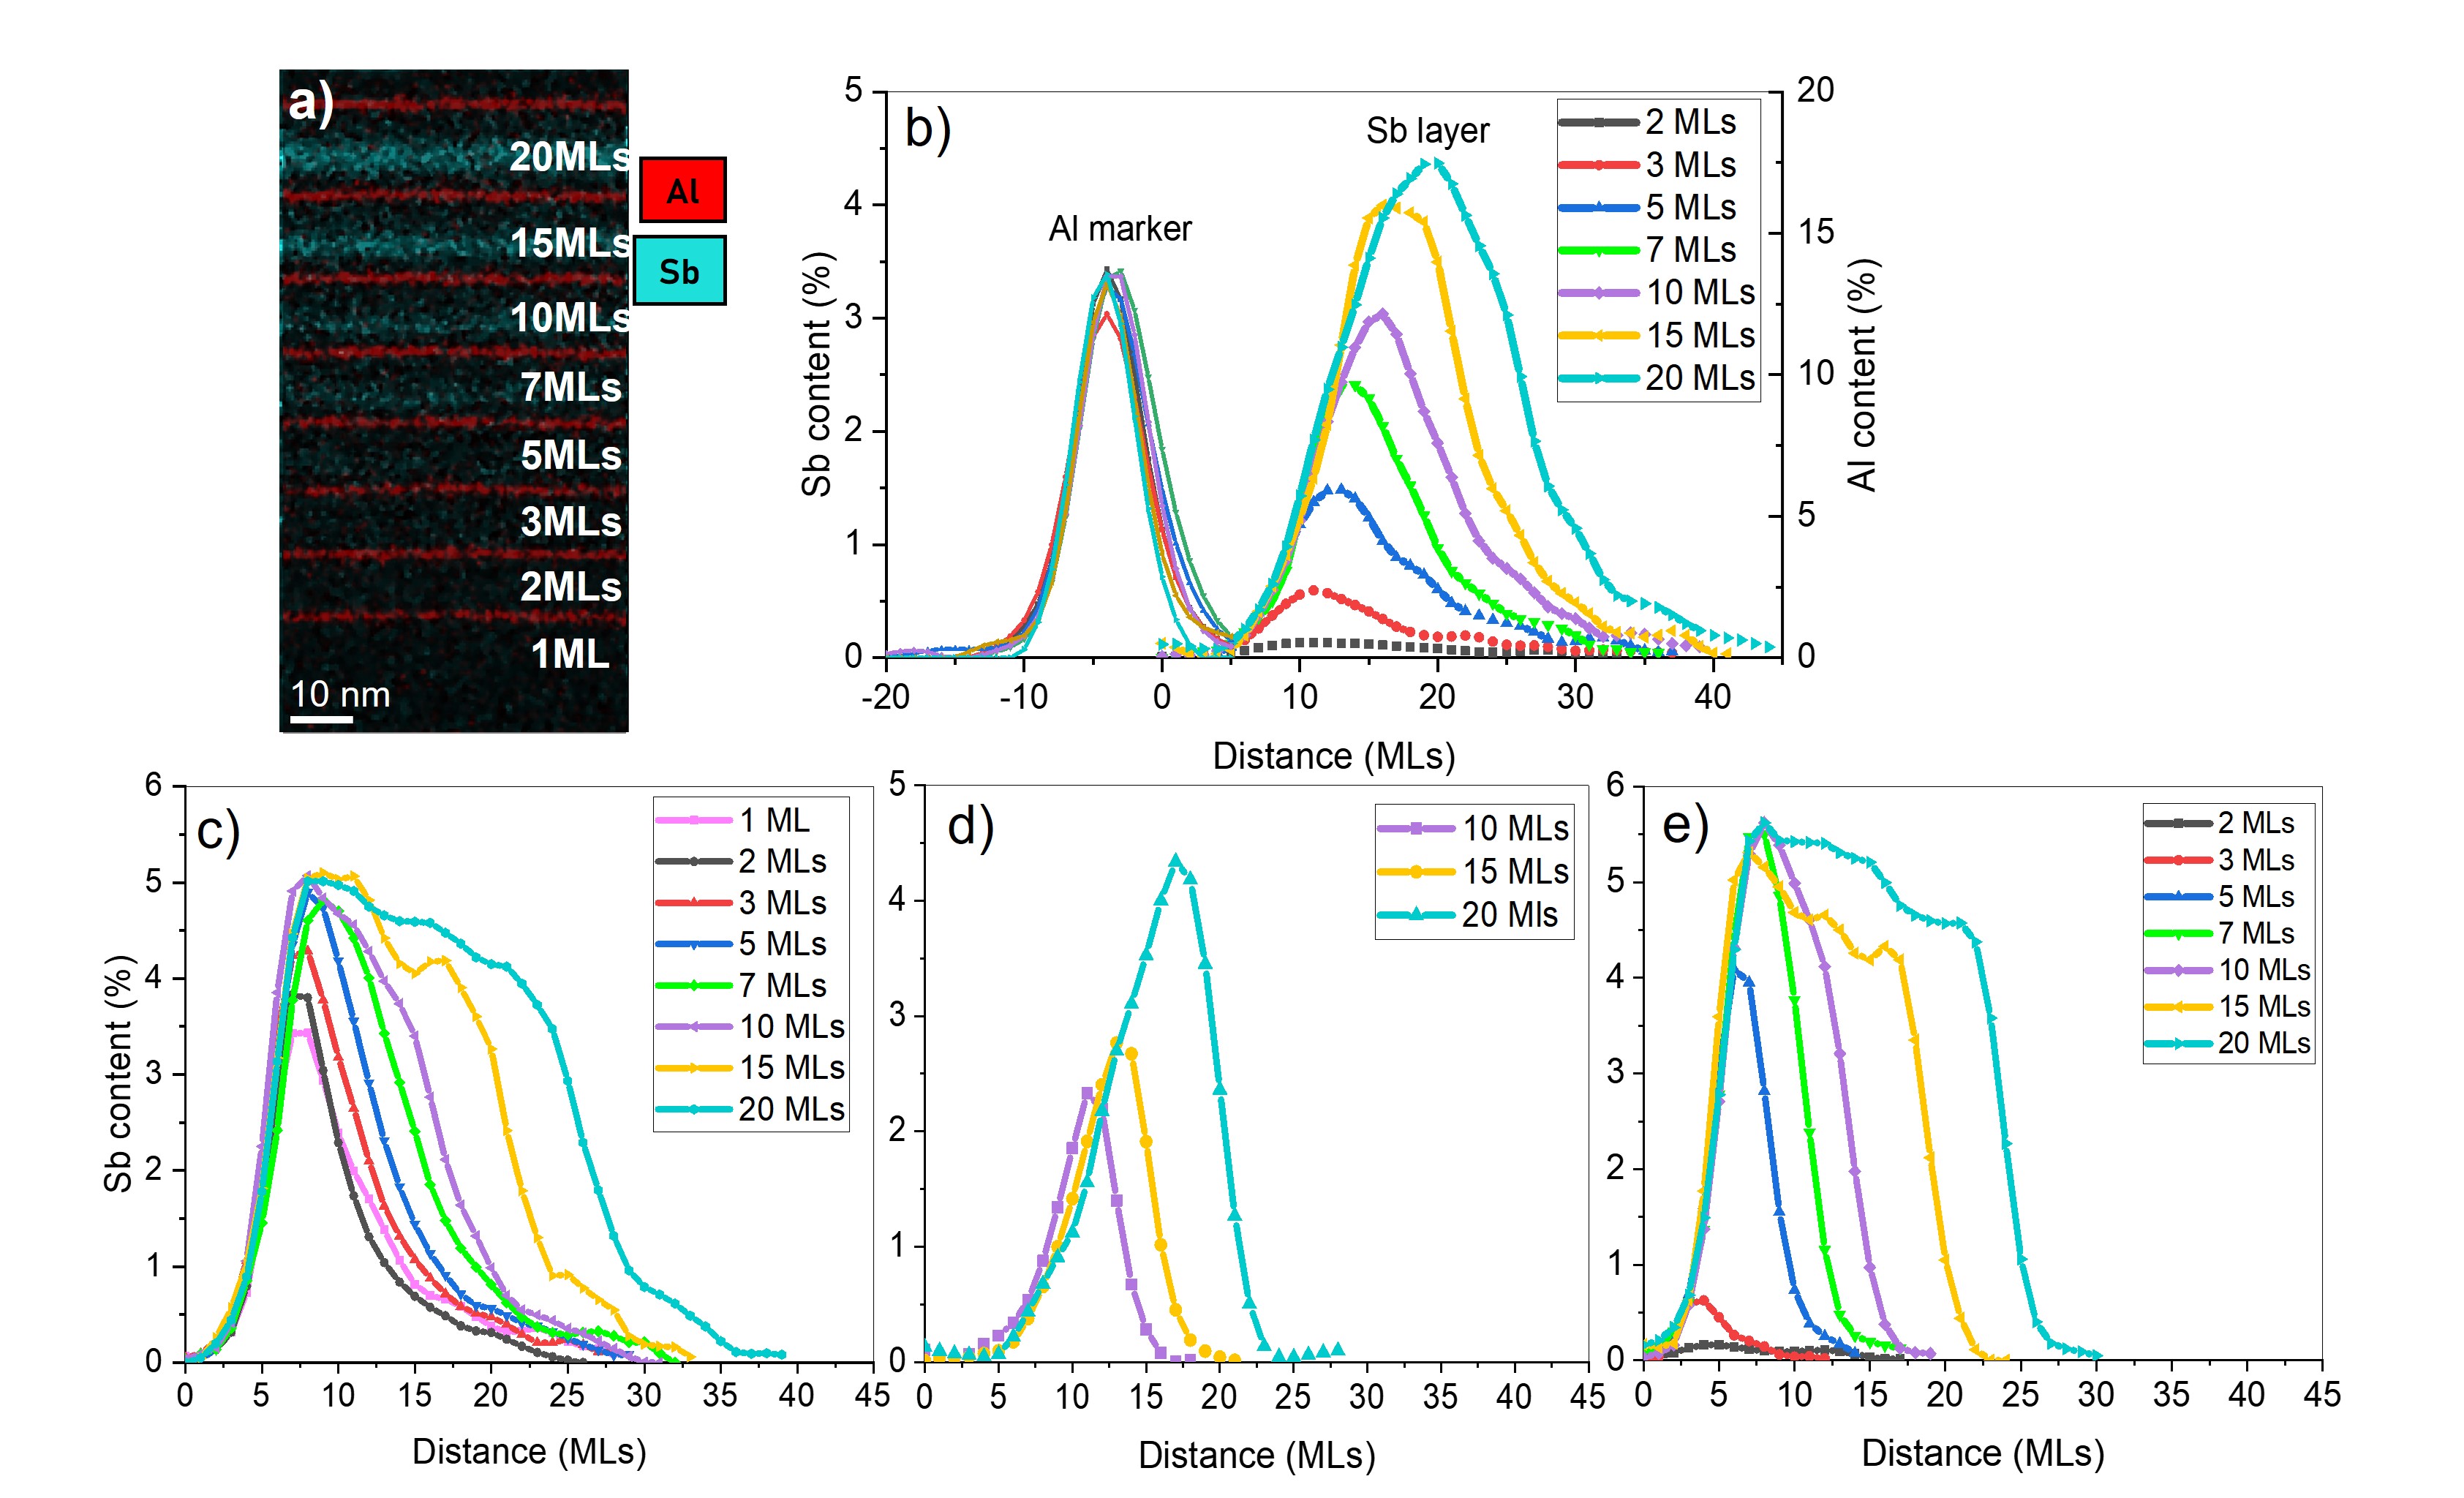
A general view of the Sb (blue) and Al (red) distribution obtained from the EDX maps in sample R is shown in Figure 1.(a). The AlAs marker to define the start of the growth is used to assemble the superposition of the composition profiles of Al and Sb along the growth direction shown in Figure 1.(b). As can be seen, the use of no GI gives rise to Gaussian profiles in which the maximum Sb content increases with the amount deposited, its peak position being shifted from the beginning. It is noteworthy that there is a delay in the Sb incorporation of 5 ML in all periods, identified by the AlAs marker. Thus, at the beginning, most of the deposited Sb content remains in the floating layer, and can only start to incorporate when it reaches a certain concentration. Applying only the soaking stage results in profiles with higher contents, which reach the maximum from the period with 3 ML of GaAsSb onwards, making the incorporation more effective (Figure 1.(c). Remarkably, the delay in the effective incorporation of Sb into the layer is reduced to 2 ML from the start. However, when desorption is applied, it drastically affects the Sb profiles, with only the three thickest GaAsSb layers being detected (Figure 1d). This means that desorption stage does not only extract Sb from the floating layer, but also activates the Sb-As ion exchange of the already deposited GaAsSb layers reducing their Sb content. Finally, applying the two strategies together gives rise to more squared profiles with higher Sb contents and sharper compositional gradients (Figure 1e). Desorption plays a very important role, leading to a steepening of the upper interfaces, but only the periods with thicknesses higher than 7 MLs reach the nominal Sb contents. Analyses of the amount of Sb accumulated or lost during the soaking and desorption stages, derived by applying the conservation of mass principle, are discussed.
CONCLUSIONS
Soaking and desorption strategies are used during growth to obtain ultrathin GaAsSb films with higher average content and well-defined interfaces. On the one hand, the soaking stage causes the Sb to be incorporated earlier and more efficiently, thus improving the quality of the lower interface. On the other hand, the desorption stages help to obtain sharper upper interfaces, but do not affect all layers equally. In the layers below 10 MLs, the application of desorption stages alone removes all traces of Sb, and only in the 20 MLs layer does it reach the nominal content. The combination of both strategies allows to obtain layers with sharper interfaces and nominal Sb content, but only for GaAsSb thicknesses above 7 MLs.
Figure 1. a) EDX colormap of sample R showing the compositional distribution of Sb (blue) and Al (red). Plots b), c), d) and e) are the composition profiles of Sb along the growth direction of samples R, S, D and SD, respectively.
- References