High Quality Quantitative Structural Analysis using Pair Distribution Function (PDF) derived from Precession Electron Diffraction (PED) Patterns
- Abstract number
- 156
- Presentation Form
- Contributed Talk
- DOI
- 10.22443/rms.mmc2023.156
- Corresponding Email
- [email protected]
- Session
- EMAG - High Resolution Structural Analysis
- Authors
- Msc. Leonardo Corrêa (1), Dr. Murilo Moreira (1), Prof. Varlei Rodrigues (1), Prof. Daniel Ugarte (1)
- Affiliations
-
1. Instituto de Física "Gleb Wataghin", UNICAMP
- Keywords
Advanced EM
Electron Crystallography
Diffraction Studies
Low-dimensional materials
Nanomaterials
Catalytic materials and supports
- Abstract text
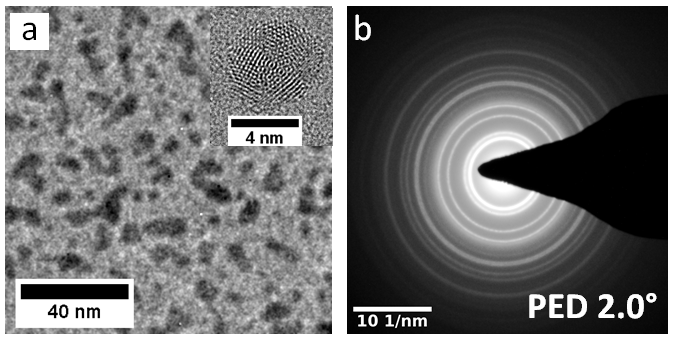
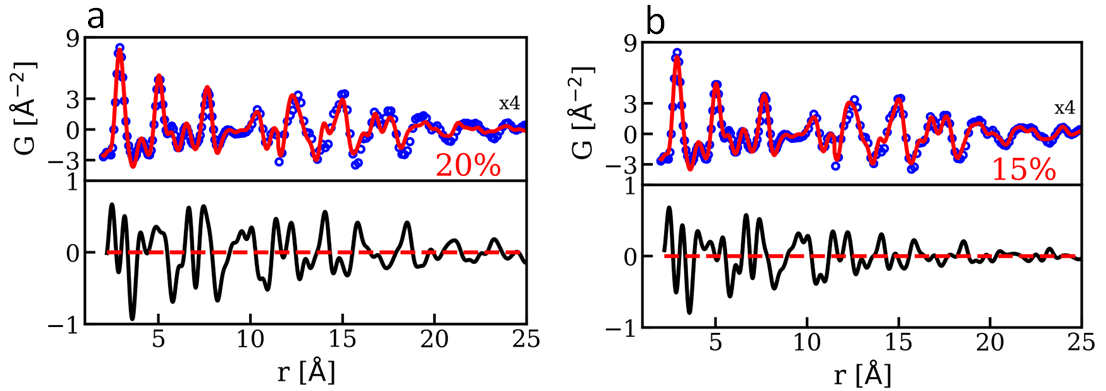
Fine structural characterization of nanocrystal is a challenging task, as many traditional crystallographic techniques are not suited for systems without long-range order. Pair distribution function (PDF) has proved to be an excellent option to perform quantitative structural analysis in materials with short and medium range atomic ordering.1 Electron-based PDF (ePDF) is an excellent alternative to study nanovolumes of materials due to the strong electron-matter interaction, but unfortunately, multiple scattering renders the quantitative evaluation of electron diffraction (ED) intensities rather complex and time consuming. Precession electron diffraction (PED) can provide the simplicity and reliability expected from x-ray diffraction due to its “quasi-kinematical” character. Then, modeling and simulations can be performed with single scattering assumptions (kinematical approximation).2 The simulations were performed with the Debye scattering equation, to account for nanostructures which can not be described by a primitive cell (e.g. polycrystalline nanoparticles, NPs).3 Here, we will describe the derivation of ePDF from PED data and, the quantitative comparison with kinematical models. Generated residues values are very close to the ones derived from synchrotron–based experiments.4 A home-made software has been developed in Python to perform all the ED processing steps and structural refinement (see Figure 1 & 2). We have applied the method to metal (AuAg) NPs generated by home-made cluster source (see Figure 1a). Best description of experiments (Figure 3) has been obtained for decahedral NPs (Dh) 3-nm in diameter, yielding a 20% residue. The use of PED has improved residue values for all analyzed cases in relation to traditional selected area electron diffraction (SAED). A careful subtraction of the substrate contribution to diffraction pattern (a-C background) has been fundamental to obtain low residues. A major improvement was obtained by including a size distribution into our Dh model (Figure 3), attaining residues as low as 15 %, similar to synchrotron values for metal NPs.4 The studied NPs show complex polycrystalline structure (Figure 1), in which structural information cannot be easily obtained from atomic resolution images. The developed PED + PDF tool has provided quantitative and statistical relevant information of the NP crystalline structure, where ~ 2000 NPs have been analyzed (representing less than a pictogram of material) with electron dose ~10 e-/Å2. We anticipate that PED-based PDF will become a reliable approach to analyze quantitatively the structure of complex NPs samples, including polycrystalline and beam sensitive materials.
Figure 1: a) TEM image of the studied AuAg nanoparticles, note that some coalescence is observable. Inset shows an atomic resolution image of a typical NP with complex polycrystalline atomic arrangement. b) PED ring-pattern utilized in our analysis. Experiments performed with a TECNAI G2 TEM (200 keV) coupled with CCD camera and Nanomegas precession system (LCE-DEMa-UFSCar, Brazil).
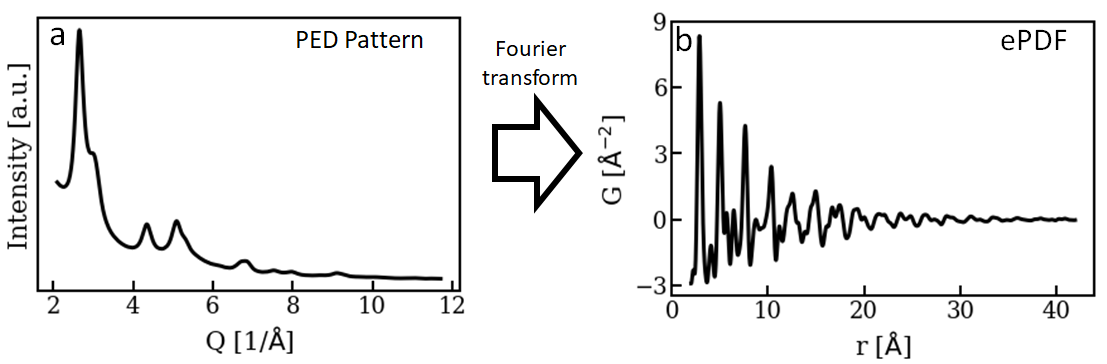
Figure 2: Schematic of data treatment: PED powder diffraction in Fig. 1b is azimuthally integrated to provide the 1D powder pattern in (a). Then a weighted Fourier transform is utilized to obtain the ePDF curve in (b).
Figure 3: Comparison between the measured (open circles) and simulated (continuous line) for sample models: a) monodisperse decahedral NPs and b) polydisperse decahedral NPs. Difference curves are displayed at the bottom of each figure.
- References
(1) T. Egami et al., Underneath the Bragg Peaks Structural Analysis of Complex Materials, Elsevier, Oxford, 2003.
(2) P. A. Midgley et al., IUCrJ, 2 126 (2015).
(3) Debye, Ann. Phys., 351 809 (1915)
(4) S. Banerjee et al., J. Phys. Chem. C, 122 29498 (2018).
(5) This research was supported by CNPq, CAPES and FAPESP (Brazil).