Observation of an increasing post L2 edge intensity from Mn to Co and Ni in EELS L2,3 white line spectra
- Abstract number
- 235
- Presentation Form
- Poster
- DOI
- 10.22443/rms.mmc2023.235
- Corresponding Email
- [email protected]
- Session
- Poster Session Two
- Authors
- Ruomu Zhang (1), Prof. Rebecca Nicholls (1), Prof. Peter Bruce (1, 2, 3), Prof. Peter Nellist (1)
- Affiliations
-
1. University of Oxford
2. The Faraday Institution
3. The Henry Royce Institute
- Keywords
EELS, L2,3 white line fine structure
- Abstract text
Electron energy loss spectroscopy (EELS) in scanning transmission electron microscopy (STEM) is a powerful technique in acquiring bonding information at high spatial resolution. The L2,3 white line ratio has been a straightforward and popular method to measure the oxidation value of transition metal ions for almost 40 years. [1,2] However, to correctly relate the absolute oxidation state value with the L2,3 white line ratio, measurements presented here suggest further correction to the current background subtraction method is required.
L2 and L3 white lines arise since the 2p1/2 and 2p3/2 electrons are excited into unfilled 3d states. For calculating the 3d occupancy through L2,3 white line ratio, there are some minor differences but it’s commonly agreed that there are 4 steps in total: Firstly, a power law fitting is performed to remove all the tails of previous peaks. Then, the multiple scattering effect can be accounted by taking a Fourier deconvolution with regard to the low loss spectrum. After that, the L2 and L3 edge will be removed because apart from the highly localised 3d states because 2p electrons will also be excited into continuous background. Finally, the area underneath L2 and L3 white line is quantified for the white line ratio.
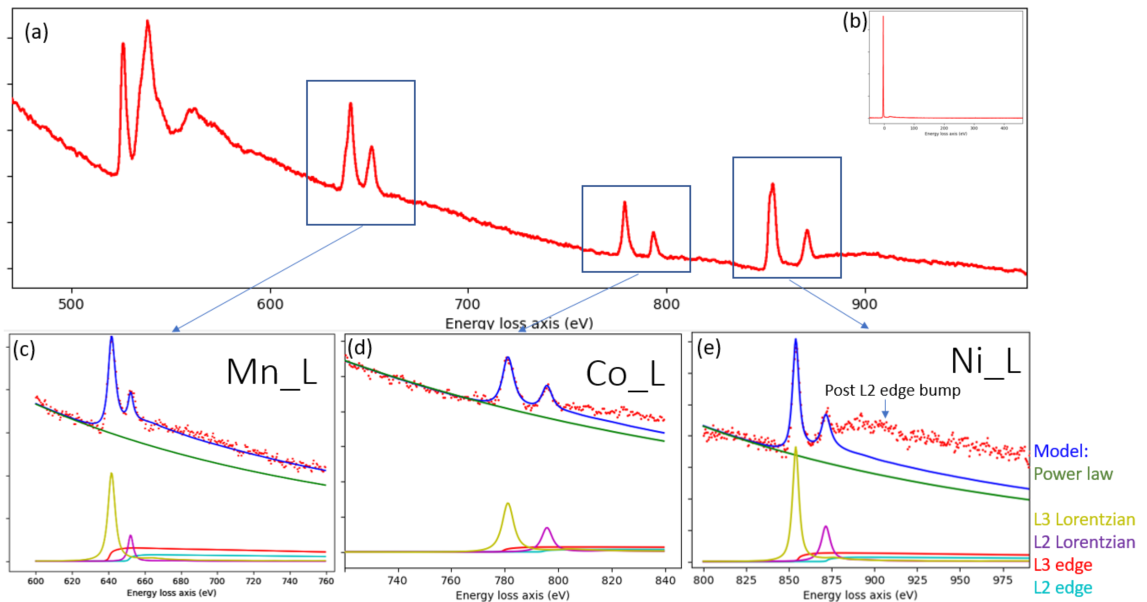
For the second step, we can create a model to forward convolve with the low loss spectrum before fitting to the experimental data to replace the Fourier deconvolution.[3] The benefit is that the ringing noise introduced by deconvolution is avoided which makes the future quantification steps easier. In addition, for lighter elements, the splitting energy of 2p1/2 and 2p3/2 is lower which causes overlapping of L2 and L3 white lines, and model fitting will account for the overlapped region (as shown in Fig.1 (c)) and provide more precise quantification of the white line area.
With this method, we observed an interesting phenomenon in an alloy Li-ion battery cathode material LiNi0.6Mn0.2Co0.2O2 (NMC622) which allows white lines from three elements to be observed simultaneously. There is an increased post L2 edge intensity with increasing atomic number from Mn to Co to Ni as shown in Fig.1. If only the Ni signal is acquired, the post L2 edge bump has been attributed to the multiple scattering effect. Nevertheless, the negligible plasmon peak in Fig.1(b) and lack of increased intensity after the Mn L2 in Fig.1(c) shows that the significant intensity after the Ni L2 white line arises intrinsically from the Ni ion rather than the multiple scattering events of a thick sample. This intensity affects the fitting of L2,3 edge in the third step significantly, A modification of our current methods is necessary to perform reliable quantification of L2,3 white line ratio, and it would be interesting to understand the origin of this feature.
In summary, we replaced the common Fourier deconvolution method with a forward convolution in model fitting to improve the accuracy in white line ratio quantification. From the comparison among Mn Co and Ni L2,3 white line on the same spectrum, the increasing post L2 edge intensity with increasing atomic number shows that further understanding of underlying electron excitation process must be considered in white line ratio quantification. [4]
Figure 1: (a) Core loss and (b) low loss spectrum of NMC622 and model fitting for (c) Mn_L2,3, (d) Co_L2,3, (e) Ni_L2,3
- References
[1] Pearson, D. H., Ahn, C. C., & Fultz, B. (1993). White lines and d-electron occupancies for the 3d and 4d transition metals. Physical Review B, 47(14), 8471.
[2] Mattheiss, L. F., & Dietz, R. E. (1980). Relativistic tight-binding calculation of core-valence transitions in Pt and Au. Physical Review B, 22(4), 1663.
[3] Lozano-Perez, S., Shen, Z., Du, D., Zhang, L. , Understanding the mechanisms of surface and crack tip oxidation with valence mapping,2019,19th International Conference on Environmental Degradation of Materials in Nuclear Power Systems - Water Reactors, EnvDeg 2019, pp. 742-749
[4] The authors acknowledge use of characterization facilities within the David Cockayne Centre for Electron Microscopy, Department of Materials, University of Oxford and in particular the Faraday Institution (FIRG007, FIRG008), the EPSRC (EP/K040375/1 “South of England Analytical Electron Microscope”) and additional instrument provision from the Henry Royce Institute (Grant reference EP/R010145/1).