Resolving macromolecular scaffolds in neurobiology by MINFLUX nanoscopy
- Abstract number
- 26
- DOI
- 10.22443/rms.mmc2023.26
- Corresponding Email
- [email protected]
- Authors
- Dr Evelyn Garlick (1), Dr Isabelle Jansen (1), Dr Clara-Marie Gürth (1), Dr Ulf Matti (1), Dr Roman Schmidt (1), Dr Christian Wurm (1)
- Affiliations
-
1. Abberior Instruments
- Keywords
MINFLUX, nanoscopy, neuroscience, single molecule localization, super resolution
- Abstract text
Cells assemble macromolecular complexes into scaffoldings that serve as substrates for catalytic processes. Although the dimensions of these scaffolds vary, their investigation is often hampered by the available resolution of the applied (light) microscopes. Especially in neuroscience, structures smaller than the diffraction limit such as the synaptic cleft or the periodic actin-spectrin cytoskeleton require advanced super resolution techniques.
MINFLUX nanoscopy is capable of resolving structures as small as 1 - 2 nm [1]. For this, single fluorophores are localized by reading out their fluorescence signal at pre-defined positions in their vicinity. 3D MINFLUX nanoscopy allows researchers to investigate the arrangement of molecules in biological samples with a localization precision < 3 nm in all three dimensions. By combining MINFLUX nanoscopy with conventional confocal microscopy, structures of interest can be identified using reference marker proteins whereupon the protein of interest is analyzed at a molecular level. Colocalization studies can benefit from the resolution in the nanometer range using two-color MINFLUX imaging.
By presenting data from current neuroscience research projects (e.g. Grabner et al., 2022 [2]) we will highlight how neurobiology can take advantage of MINFLUX nanoscopy, and how MINFLUX can be applied to overcome the limitations of alternative technologies.
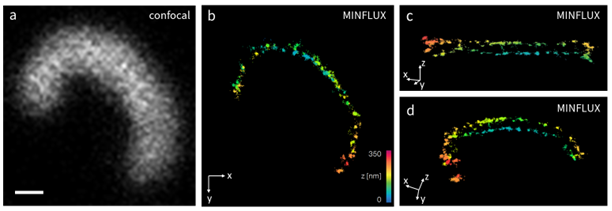
Figure 1. Confocal (a) and 3D MINFLUX images (b-d) of bassoon in a photoreceptor ribbon synapse. Bassoon was stained in a thin immobilized layer of retina tissue with Alexa Fluor 647 by indirect immunolabeling. b-d: Different views of the MINFLUX data in 3D rendering, color-coding according to axial position z. Scale bar: 200 nm.
- References
[1] Schmidt et al. (2021) MINFLUX nanometer-scale 3D imaging and microsecond-range tracking on a common fluorescence microscope. Nat Commun. 2021 Mar 5;12(1):1478
[2] Grabner et al. (2022) Resolving the molecular architecture of the photoreceptor active zone with 3D-MINFLUX. Sci Adv. 2022 Jul 15;8(28):eabl7560.