Noble Gas Bubbles in Thin Films
- Abstract number
- 318
- Presentation Form
- Poster Flash Talk + Poster
- Corresponding Email
- [email protected]
- Session
- Poster Session 2
- Authors
- Rebecca B. Cummings (2), Riccardo Bassiri (1), Iain W. Martin (2), Ian MacLaren (2)
- Affiliations
-
1. Stanford University
2. University of Glasgow
- Keywords
EELS, thin films, mirror coatings, noble gas bubbles, electron microscopy
- Abstract text
The noble gas content of two different thin films was quantified in a spatially resolved way using DualEELs and high angle annular dark field (HAADF) images. DualEELS is a form of electron energy loss spectroscopy (EELS) that takes two spectra, one from the low-loss region and one from the high-loss region, in quick succession. Absolute quantification of the noble gas areas is possible using the process proposed by Craven in 2016 [1].
This contribution will apply a modified version of this technique to two noble gases, argon and xenon. These two cases have applications in increasing the sensitivity of gravitational wave detectors and better understanding the behaviour of nuclear reactor cladding, respectively. The argon gas is in titanium dioxide doped tantalum pentoxide and the xenon in Zircaloy-4. The argon content in the Ta2O5 films comes from the deposition process, which is argon ion-beam deposition. For the Zircaloy-4 films the xenon was deliberately implanted using Xe-ion irradiation.
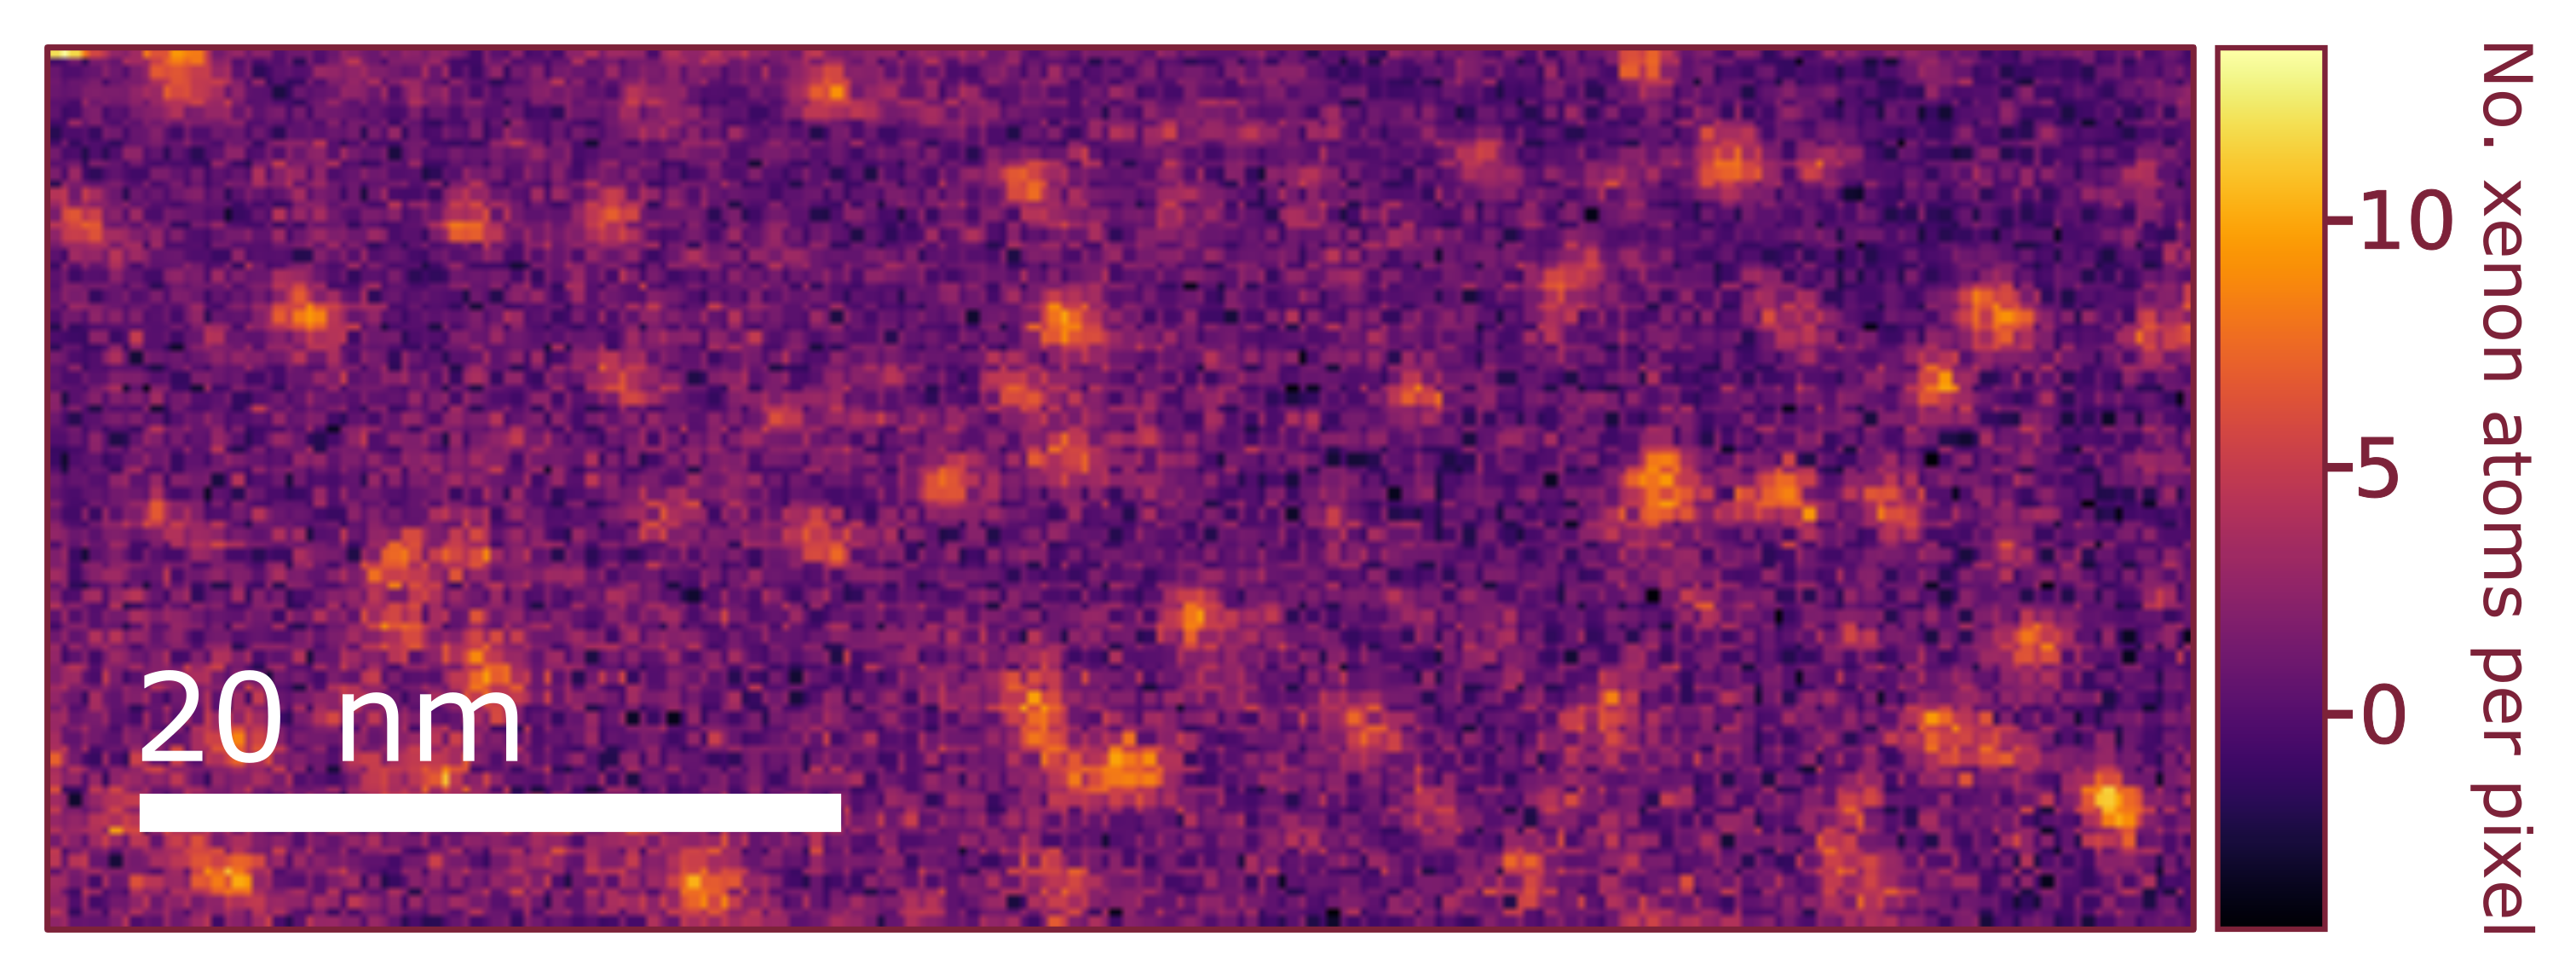
Figure 1: A map of the xenon content in one of the datasets of the Zircaloy-4 sample. The xenon is visible in the lighter regions and the intensity shows the number of xenon atoms in the columns represented by the pixels. The small scale demonstrates the sensitivitity of the technique. The colourmap is inferno from matplotlib [2].
Tantalum pentoxide is used as an optical coating for mirrors in gravitational wave detectors. Fully understanding the structure of the coatings is the first step towards reducing their noise contributions, thus improving the sensitivity of the detector. Lower noise will increase the sensitivity of the detector. Xenon bubbles in the cladding of nuclear reactors are well documented; xenon is a fission product and the bubbles are formed after it implants into the cladding as ions and then captures electrons. The sample investigated was made by a process that directly mimics the that which occurs within reactors. On a small scale, such as in these samples, the bubbles can affect the optical and physical properties of the films; on a large scale, such as in a reactor, they may weaken the reactor cladding.
Three Ta2O5 films were investigated to see if there was a relationship between annealing temperature and bubble formation. It was shown using HAADF imaging that after annealing at 400 ºC the argon in the film started to coalesce into bubbles and after annealing at 600°C these bubbles grew larger and more defined. A semi-empirical standard was created for the quantification using argon data from the EELS Atlas [3] and experimental data scaled using a Hartree Slater cross-section. The density and pressure of argon within the bubbles was calculated for 35 bubbles in the 600 °C sample. The pressures were calculated using the Van der Waals equation. The bubbles had a mean diameter, density and pressure of 22 Å, 870 kg/m3 and 400 MPa, respectively. The bubbles are thus a high-density liquid [4].
The same spatially resolved quantification technique was then applied to the Zircaloy-4 film. It was once again shown that xenon was present in the film using HAADF images, and that it had grouped into bubbles. A semi-empirical standard was made using the EELS Atlas [3] and experimental data that was scaled using a Hartree Slater cross-section. The densities and pressures of 244 xenon bubbles were calculated, the pressures using the appropriate form of Jelea's equation of state for xenon/krypton mixtures confined in nuclear fuels [5]. On average, the xenon bubbles had a diameter of 21.4 Å, a density of 2333 kg/m3 and a pressure of 113 GPa.
This spatially resolved quantification technique is capable of isolating a very small fraction of the total EELS signal and using it to calculate the densities and pressures of nanoscale bubbles. It can be readily applied to various materials that contain small gas bubbles, so long as an EELS edge in the right energy range is present for the gas of interest.- References
[1] A. J. Craven, J. Bobynko, B. Sala, and I. MacLaren, “Accurate measurement of ab- solute experimental inelastic mean free paths and EELS differential cross-sections,” Ultramicroscopy, vol. 170, pp. 113 – 127, 2016.
[2] J. D. Hunter, “Matplotlib: A 2D graphics environment,” Computing in Science & Engineering, vol. 9, no. 3, pp. 90–95, 2007.
[3] C. Ahn and O. Krivanek, EELS Atlas: a reference guide of electron energy loss spectra covering all stable elements. Gatan, 1983.
[4] R. B. Cummings, R. Bassiri, I. W. Martin, and I. MacLaren, “Argon bubble formation in tantalum oxide-based films for gravitational wave interferometer mirrors,” Opt. Mater. Express, vol. 11, pp. 707–718, Mar 2021.
[5] A. Jelea, “An equation of state for xenon/krypton mixtures confined in the nuclear fuels,” Journal of Nuclear Materials, vol. 530, p. 151952, 2020.

