Understanding Electron Beam Effects on Liquid-phase Specimens using Low Dose Electron Energy-Loss Spectroscopy
- Abstract number
- 218
- Presentation Form
- Submitted Talk
- Corresponding Email
- [email protected]
- Session
- Stream 2: EMAG - In-situ microscopy
- Authors
- Dr Liam Spillane (1), Dr Sophia Betzler (2, 3), Dr Ming Pan (1), Dr Ray Twesten (1), Dr Haimei Zheng (2)
- Affiliations
-
1. Gatan Inc.
2. MSD LBL, Molecular Foundry
3. College of Chemistry, UC Berkeley
- Keywords
STEM, EELS, Low Dose, Liquid Phase, Liquid Cell, Scanning Transmission Electron Microscopy, Electron Energy-Loss Spectroscopy, Spectroscopy, Beam Sensitive Materials, Liquid Cell Microscopy, Electron Counting, Radiolysis, Beam Damage,
- Abstract text
Liquid cell electron microscopy has been used to investigate and study many chemical reactions in real time, such as: nanoparticle growth, battery electrochemistry and catalysis. Understanding the electron beam-specimen interactions present in liquid phase is a fundamental step toward the correct interpretation of in-situ observations derived from such experiments, in order to allow conclusions to be drawn with confidence that may then be applied to macroscopic systems ex-situ.
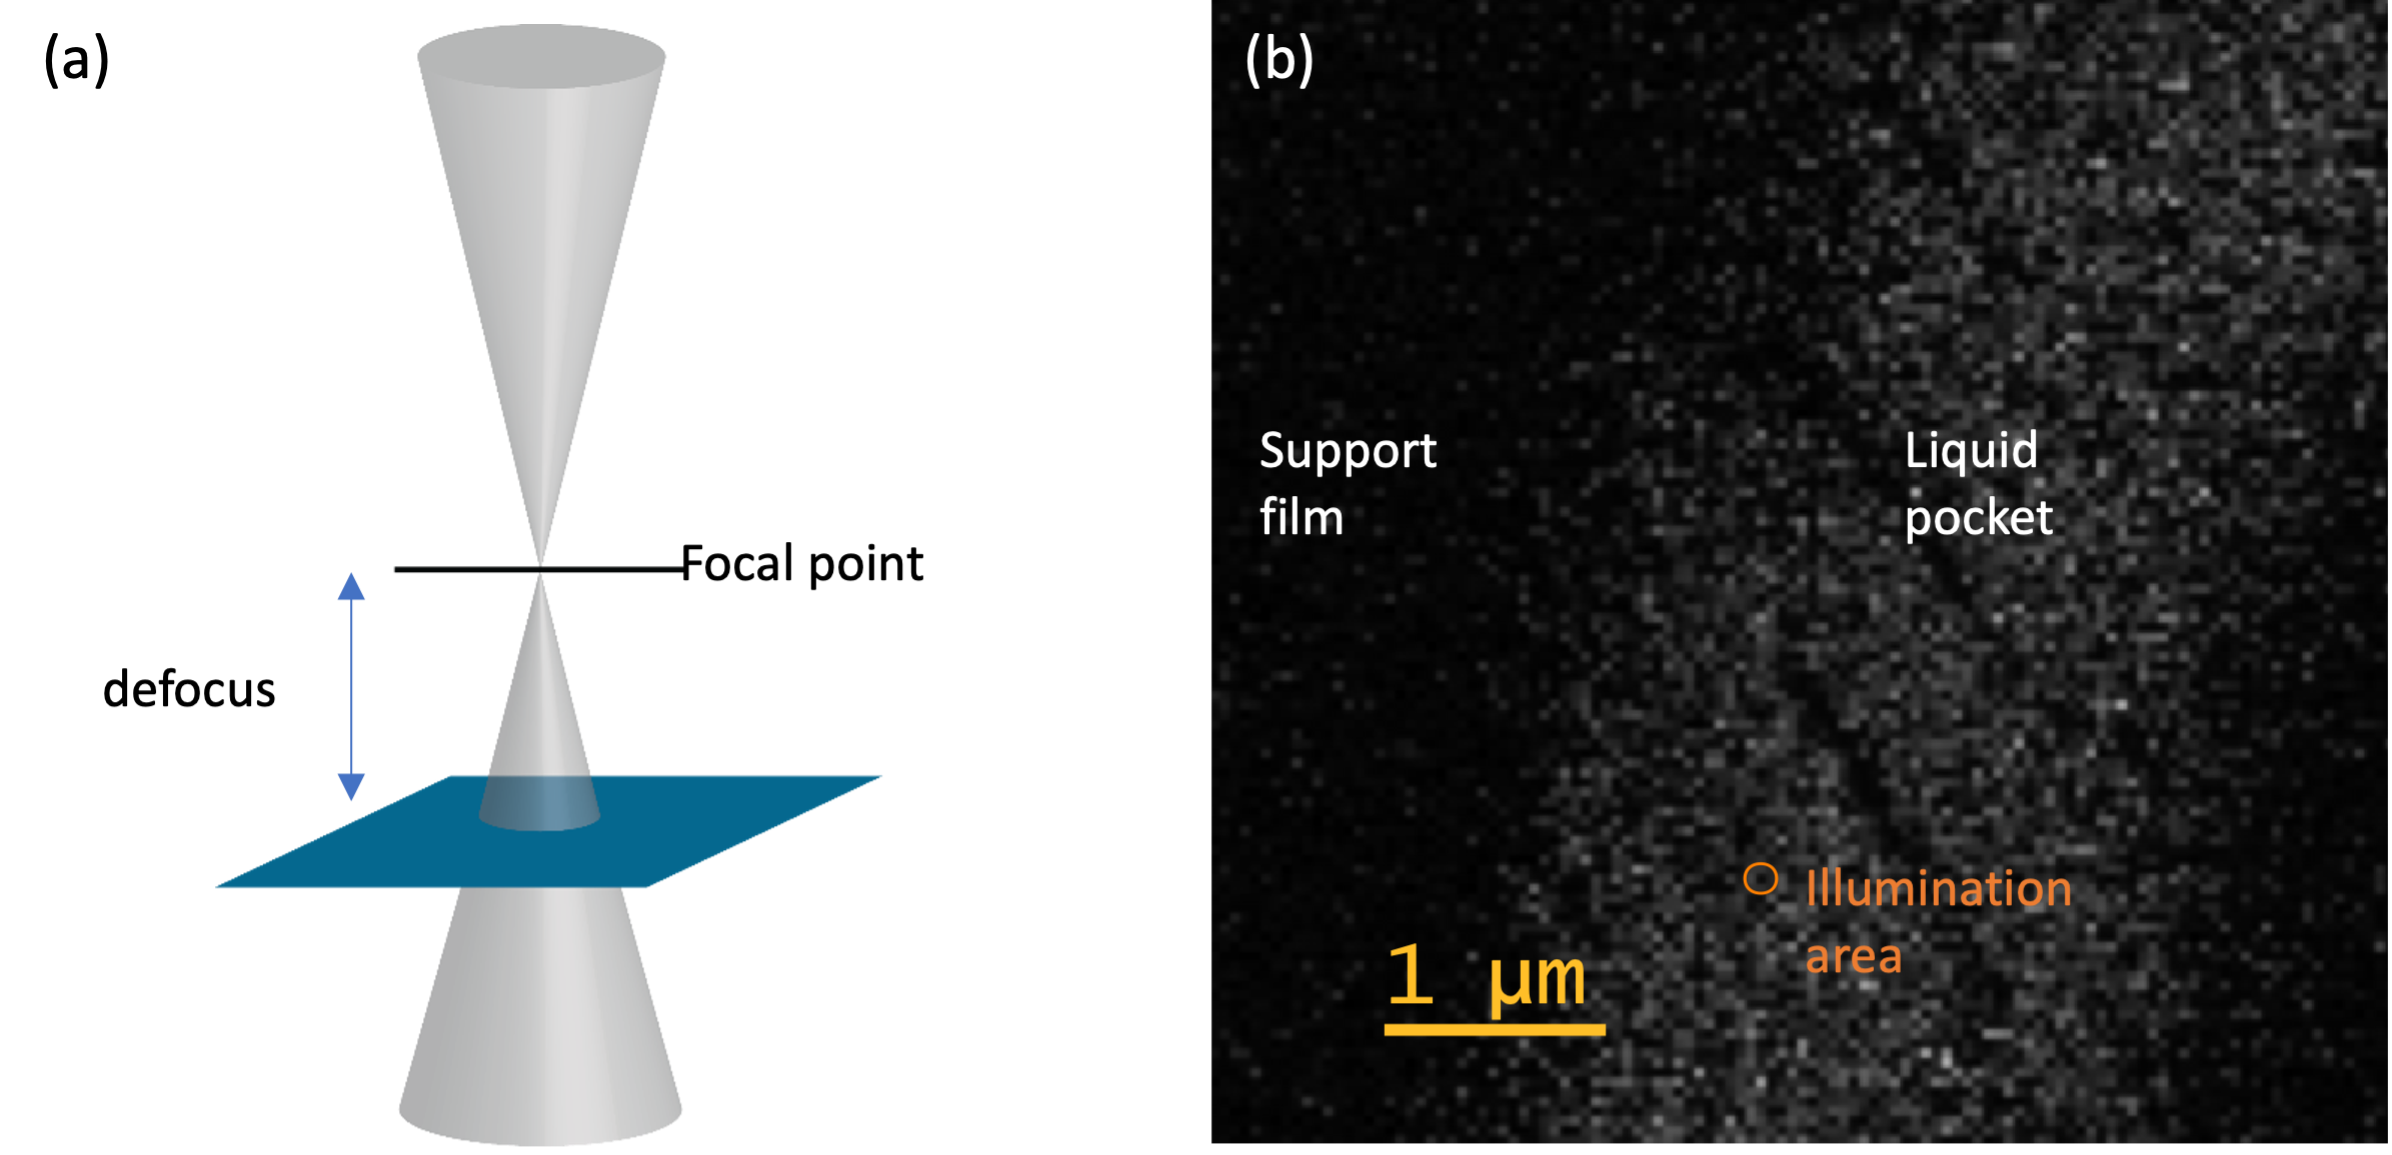
Electron energy-loss spectroscopy (EELS) performed in the scanning transmission electron microscope (STEM) is well established as a potent technique for probing local chemistry and electronic structure at high spatial resolution. However, where high spatial resolution is not a requirement of a given experiment, STEM-EELS becomes ideal for providing highly tunable and well-defined specimen dose. Dose rate and therefore the accumulated dose, is a function of probe current and probe defocus (figure 1). As both the probe position and scan area are also inherently precise in STEM, it is possible to irradiate target specimen features to nearly the “first electron” dose (~ 0 e-/Å2). To acquire useable data at ultra-low dose and also at high dose resolution, a detector that is both high speed and high sensitivity is a fundamental requirement.
In this work, we use a transmission-mode electron-counting detector fitted to an optimized EELS spectrometer (GIF Continuum K3) to acquire time resolved electron energy-loss from carbonate solutions to study early reaction products formed from the interaction between the electron beam and aqueous solution. Radiolysis of these solutions produces a number of molecular reaction products (CO2, CO, O2, H2) all of which display characteristic spectral features in the low energy-loss region of the EELS spectrum. Using this detector-spectrometer configuration, it was possible to acquire low-loss EELS spectra at an ultra-low probe current (0.2 pA) and access useable dose rates as low as 0.15 e-/Å2/spectrum.
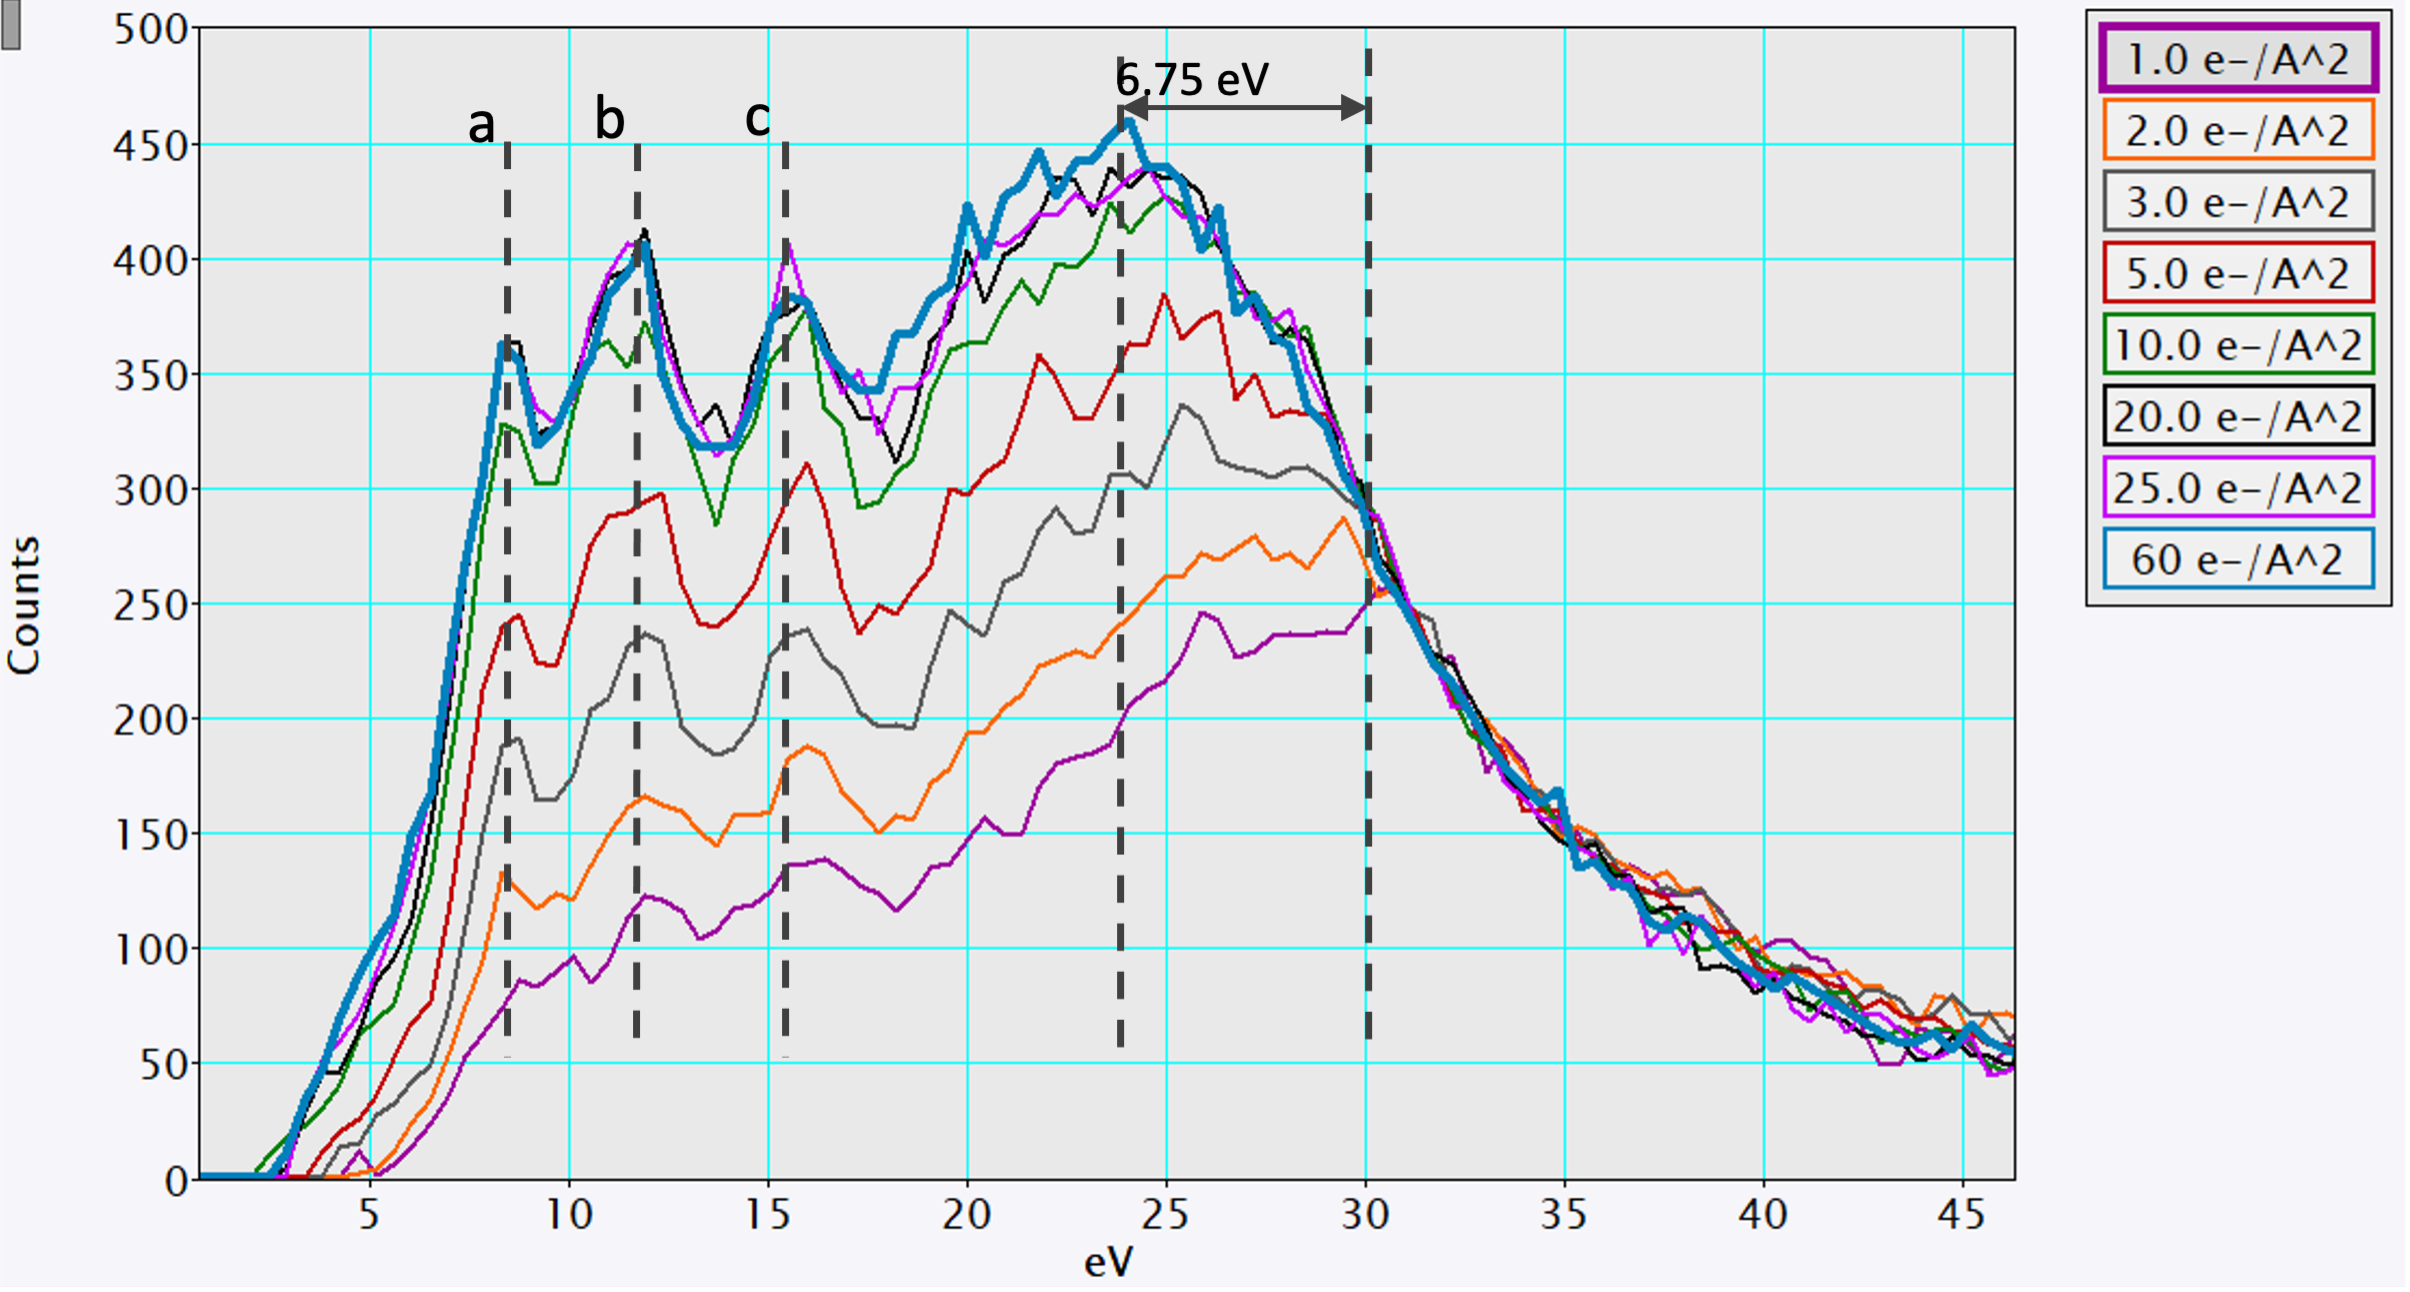
Initial results show the formation of three characteristic peaks in the low-loss region at specimen doses as low as 1.0 e/Å2. The normalized peak intensity of these features was seen to increase up to doses of approximately 10.0 e-/Å2. Above 10.0 e-/Å2, no measurable changes were observed up to doses of 60.0 e-/Å2 (figure 2). In this presentation, we will expand upon these findings and demonstrate low-dose STEM and temperature dependent EELS as experimental approaches that provide detailed understanding of the different stages of the radiolytic degradation of liquids during in-situ liquid cell experiments. These insights are essential to limit the impact of radiolysis on the results of liquid cell experiments by developing efficient protection strategies.
This work was supported by the U.S. Department of Energy (DOE), Office of Science, Office of Basic Energy Sciences (BES), Materials Sciences and Engineering Division under Contract No. DE-AC02-05-CH11231 within the KC22ZH program. Work at the Molecular Foundry of Lawrence Berkeley National Laboratory (LBNL) was supported by the Office of Science, Office of Basic Energy Sciences, of the U.S. Department of Energy under Contract No. DE-AC02-05CH11231.
Figure 1: (a) Schematic diagram showing effect of STEM probe overfocus on illumination area at specimen position. (b) Example ADF STEM image showing support film and liquid pocket regions from a typical liquid cell specimen. Illumination area shown is 80 nm in diameter.
Figure 2: Single scattering distribution (SSD) low-loss spectra from aqueous carbonate solution specimen at accumulated doses of: (1.0, 2.0, 3.0, 5.0, 10.0, 20.0, 25.0, 60) e-/Å2. SSD achieved by Fourier-log deconvolution. SSD spectra were normalized against relative thickness and integral in the 30 – 35 eV energy window. Characteristic peaks a, b and c were found to increase in intensity up to a dose of 10.0 e-/Å2. A shift in plasmon energy of 6.75 eV was also observed.


